
一.系统环境
本文主要基于Kubernetes1.21.9和Linux操作系统CentOS7.4。
| 服务器版本 | EFK版本 | docker软件版本 | Kubernetes(k8s)集群版本 | CPU架构 |
|---|---|---|---|---|
| CentOS Linux release 7.4.1708 (Core) | 7.9.1 | Docker version 20.10.12 | v1.21.9 | x86_64 |
Kubernetes集群架构:k8scloude1作为master节点,k8scloude2,k8scloude3作为worker节点。
| 服务器 | 操作系统版本 | CPU架构 | 进程 | 功能描述 |
|---|---|---|---|---|
| k8scloude1/192.168.110.130 | CentOS Linux release 7.4.1708 (Core) | x86_64 | docker,kube-apiserver,etcd,kube-scheduler,kube-controller-manager,kubelet,kube-proxy,coredns,calico | k8s master节点 |
| k8scloude2/192.168.110.129 | CentOS Linux release 7.4.1708 (Core) | x86_64 | docker,kubelet,kube-proxy,calico | k8s worker节点 |
| k8scloude3/192.168.110.128 | CentOS Linux release 7.4.1708 (Core) | x86_64 | docker,kubelet,kube-proxy,calico | k8s worker节点 |
二.前言
随着应用程序数量和规模的增长,日志管理变得越来越重要。日志管理系统可以帮助我们收集、存储、分析和可视化日志数据,以便快速诊断问题、监控性能等。在Kubernetes上部署一个可靠的日志管理系统是非常必要的。
在Kubernetes(k8s)上使用helm安装部署日志管理系统EFK的前提是已经有一套可以正常运行的Kubernetes集群,关于Kubernetes(k8s)集群的安装部署,可以查看博客《Centos7 安装部署Kubernetes(k8s)集群》https://www.cnblogs.com/renshengdezheli/p/16686769.html。
三.日志管理系统EFK简介
EFK是Elasticsearch、Fluentd和Kibana的缩写,它们都是开源软件。这三个软件组合在一起可以形成一个完整的日志管理系统,其中:
- Elasticsearch:用于存储、索引和搜索大量的结构化和非结构化数据。
- Fluentd:用于采集、转换和发送日志数据到Elasticsearch。
- Kibana:用于可视化和分析从Elasticsearch中检索到的数据。
EFK具有以下优点:
- 开源且免费。
- 扩展性好,可以处理大量的日志数据。
- 支持自定义插件,可以方便地进行扩展和定制。
- 支持实时查询和分析,可以快速诊断和解决问题。
- 支持多种数据可视化方式,例如柱状图、折线图等。
日志管理系统EFK架构如下:


除了EFK,你肯定还听说过ELK,ELK是Elasticsearch、Logstash和Kibana的缩写,它们也都是开源软件。和EFK类似,ELK也可以形成一个完整的日志管理系统,其中:
- Elasticsearch:用于存储、索引和搜索大量的结构化和非结构化数据。
- Logstash:用于采集、转换和发送日志数据到Elasticsearch。
- Kibana:用于可视化和分析从Elasticsearch中检索到的数据。
EFK和ELK的主要区别在于:
- Fluentd相对于Logstash更加轻量级,而且具有更好的性能。
- Elasticsearch相对于Logstash更加强大,可以自行处理数据采集和转换的任务,因此不需要使用Logstash。
- EFK更加灵活和易于扩展,支持自定义插件,可以方便地进行定制和扩展。
四.helm安装EFK
本文将介绍如何使用Helm在Kubernetes上部署一个日志管理系统EFK。关于helm的详细用法可以查看博客《Kubernetes(k8s)包管理工具Helm:Helm包管理》。
现在没有应用被安装。
[root@k8scloude1 ~]# helm ls NAME NAMESPACE REVISION UPDATED STATUS CHART APP VERSION 添加EFK官方 helm 源。
[root@k8scloude1 ~]# helm repo add elastic https://helm.elastic.co "elastic" has been added to your repositories 查看helm现在的仓库源。
[root@k8scloude1 ~]# helm repo list NAME URL azure http://mirror.azure.cn/kubernetes/charts/ ali https://apphub.aliyuncs.com myhelmrepo http://192.168.110.129/mycharts elastic https://helm.elastic.co 在kubernetes集群的所有节点,创建存放EFK文件的目录。
[root@k8scloude1 ~]# mkdir efk [root@k8scloude1 ~]# cd efk/ [root@k8scloude2 ~]# mkdir efk [root@k8scloude2 ~]# cd efk/ [root@k8scloude3 ~]# mkdir efk [root@k8scloude3 ~]# cd efk/ 4.1 helm在线安装EFK
查询helm仓库里所有可得的elasticsearch。
[root@k8scloude1 ~]# helm search repo elasticsearch NAME CHART VERSION APP VERSION DESCRIPTION ali/elasticsearch 11.0.4 7.6.0 A highly scalable open-source full-text search ... ...... azure/fluentd-elasticsearch 2.0.7 2.3.2 DEPRECATED! - A Fluentd Helm chart for Kubernet... elastic/elasticsearch 7.16.3 7.16.3 Official Elastic helm chart for Elasticsearch ali/apm-server 2.1.5 7.0.0 The server receives data from the Elastic APM a... ali/dmarc2logstash 1.2.0 1.0.3 Provides a POP3-polled DMARC XML report injecto... ...... elastic/eck-operator 2.0.0 2.0.0 A Helm chart for deploying the Elastic Cloud on... elastic/eck-operator-crds 2.0.0 2.0.0 A Helm chart for installing the ECK operator Cu... 下载elasticsearch7.16.3版本,--version=7.16.3 指定下载的版本。
[root@k8scloude1 ~]# helm pull elastic/elasticsearch --version=7.16.3 下载elasticsearch7.9.1版本。
[root@k8scloude1 ~]# helm pull elastic/elasticsearch --version=7.9.1 现在两个不同版本的包已经下载下来了。
[root@k8scloude1 ~]# ls elasticsearch-7.* elasticsearch-7.16.3.tgz elasticsearch-7.9.1.tgz 解压。
[root@k8scloude1 ~]# tar xf elasticsearch-7.16.3.tgz [root@k8scloude1 ~]# cd elasticsearch/ 可以查看版本号。
[root@k8scloude1 elasticsearch]# ls Chart.yaml examples Makefile README.md templates values.yaml [root@k8scloude1 elasticsearch]# cat Chart.yaml apiVersion: v1 appVersion: 7.16.3 description: Official Elastic helm chart for Elasticsearch home: https://github.com/elastic/helm-charts icon: https://helm.elastic.co/icons/elasticsearch.png maintainers: - email: helm-charts@elastic.co name: Elastic name: elasticsearch sources: - https://github.com/elastic/elasticsearch version: 7.16.3 可以对应的修改values.yaml文件,进行配置。
[root@k8scloude1 elasticsearch]# vim values.yaml 安装elasticsearch。
[root@k8scloude1 ~]# helm install elasticsearch elasticsearch 类似的,像这样安装Fluentd和Kibana即可。
4.2 helm离线安装EFK(推荐)
因为EFK所需的镜像都比较大,所以提前把EFK的镜像包,helm包都下载好,使用的是7.9.1版本,tar是镜像包,tgz是helm包。
[root@k8scloude1 efk]# ls elastic7.9.1.tar elasticsearch-7.9.1.tgz filebeat7.9.1.tar filebeat-7.9.1.tgz kibana7.9.1.tar kibana-7.9.1.tgz metricbeat7.9.1.tar metricbeat-7.9.1.tgz 把EFK镜像包传到其他worker节点,需要加载镜像。
[root@k8scloude1 efk]# scp elastic7.9.1.tar filebeat7.9.1.tar kibana7.9.1.tar metricbeat7.9.1.tar k8scloude2:/root/efk/ [root@k8scloude1 efk]# scp elastic7.9.1.tar filebeat7.9.1.tar kibana7.9.1.tar metricbeat7.9.1.tar k8scloude3:/root/efk/ 接下来加载EFK镜像,所有节点都操作。
[root@k8scloude1 efk]# for i in elastic7.9.1.tar ; do docker load -i elastic7.9.1.tar ; docker load -i filebeat7.9.1.tar ; docker load -i kibana7.9.1.tar ; docker load -i metricbeat7.9.1.tar ; done 613be09ab3c0: Loading layer [==================================================>] 211.1MB/211.1MB ...... 13cbc7f1710b: Loading layer [==================================================>] 496.1kB/496.1kB Loaded image: docker.elastic.co/elasticsearch/elasticsearch:7.9.1 5f5944cf8fa3: Loading layer [==================================================>] 23.96MB/23.96MB ...... 00b987e8c2be: Loading layer [==================================================>] 374.8kB/374.8kB Loaded image: docker.elastic.co/beats/filebeat:7.9.1 d81c06fbe333: Loading layer [==================================================>] 31.33MB/31.33MB ...... e2e362ce9c59: Loading layer [==================================================>] 374.8kB/374.8kB Loaded image: docker.elastic.co/kibana/kibana:7.9.1 6f13949e424b: Loading layer [==================================================>] 138.9MB/138.9MB ...... 29e2f99d88c3: Loading layer [==================================================>] 374.8kB/374.8kB Loaded image: docker.elastic.co/beats/metricbeat:7.9.1 [root@k8scloude1 efk]# docker images | egrep "elastic|filebeat|kibana|metricbeat" docker.elastic.co/kibana/kibana 7.9.1 2f79360c362e 17 months ago 1.18GB docker.elastic.co/elasticsearch/elasticsearch 7.9.1 22008d6d4b2d 17 months ago 762MB docker.elastic.co/beats/metricbeat 7.9.1 0a9e2b2ee772 17 months ago 505MB docker.elastic.co/beats/filebeat 7.9.1 a48d035fe91b 17 months ago 449MB [root@k8scloude2 efk]# for i in elastic7.9.1.tar ; do docker load -i elastic7.9.1.tar ; docker load -i filebeat7.9.1.tar ; docker load -i kibana7.9.1.tar ; docker load -i metricbeat7.9.1.tar ; done [root@k8scloude2 efk]# docker images | egrep "elastic|filebeat|kibana|metricbeat" docker.elastic.co/kibana/kibana 7.9.1 2f79360c362e 17 months ago 1.18GB docker.elastic.co/elasticsearch/elasticsearch 7.9.1 22008d6d4b2d 17 months ago 762MB docker.elastic.co/beats/metricbeat 7.9.1 0a9e2b2ee772 17 months ago 505MB docker.elastic.co/beats/filebeat 7.9.1 a48d035fe91b 17 months ago 449MB [root@k8scloude3 efk]# for i in elastic7.9.1.tar ; do docker load -i elastic7.9.1.tar ; docker load -i filebeat7.9.1.tar ; docker load -i kibana7.9.1.tar ; docker load -i metricbeat7.9.1.tar ; done [root@k8scloude3 efk]# docker images | egrep "elastic|filebeat|kibana|metricbeat" docker.elastic.co/kibana/kibana 7.9.1 2f79360c362e 17 months ago 1.18GB docker.elastic.co/elasticsearch/elasticsearch 7.9.1 22008d6d4b2d 17 months ago 762MB docker.elastic.co/beats/metricbeat 7.9.1 0a9e2b2ee772 17 months ago 505MB docker.elastic.co/beats/filebeat 7.9.1 a48d035fe91b 17 months ago 449MB 已经提前把所有的EFK helm包都下载好了。
[root@k8scloude1 efk]# ls elasticsearch-7.9.1.tgz filebeat-7.9.1.tgz kibana-7.9.1.tgz metricbeat-7.9.1.tgz 解压elasticsearch。
[root@k8scloude1 efk]# tar xf elasticsearch-7.9.1.tgz [root@k8scloude1 efk]# ls elasticsearch elasticsearch-7.9.1.tgz filebeat-7.9.1.tgz kibana-7.9.1.tgz metricbeat-7.9.1.tgz [root@k8scloude1 efk]# cd elasticsearch/ [root@k8scloude1 elasticsearch]# ls Chart.yaml examples Makefile README.md templates values.yaml 修改elasticsearch的values.yaml配置文件。
[root@k8scloude1 elasticsearch]# vim values.yaml /* #elasticsearch/values.yaml文件修改内容如下 #因为我们k8s集群只有两个worker节点 ,所以副本数修改为2 replicas: 2 #一个master节点 minimumMasterNodes: 1 #去除持久性储存 volumes: - secret - configMap # - persistentVolumeClaim persistence: enabled: false */ 所需镜像版本要修改和自己下载的版本一致。
[root@k8scloude1 elasticsearch]# grep image values.yaml image: "docker.elastic.co/elasticsearch/elasticsearch" imageTag: "7.9.1" imagePullPolicy: "IfNotPresent" 安装elasticsearch。
[root@k8scloude1 elasticsearch]# helm install elasticsearch . W0317 11:09:06.285376 35427 warnings.go:70] policy/v1beta1 PodDisruptionBudget is deprecated in v1.21+, unavailable in v1.25+; use policy/v1 PodDisruptionBudget W0317 11:09:06.322279 35427 warnings.go:70] policy/v1beta1 PodDisruptionBudget is deprecated in v1.21+, unavailable in v1.25+; use policy/v1 PodDisruptionBudget NAME: elasticsearch LAST DEPLOYED: Thu Mar 17 11:09:05 2022 NAMESPACE: helm STATUS: deployed REVISION: 1 NOTES: 1. Watch all cluster members come up. $ kubectl get pods --namespace=helm -l app=elasticsearch-master -w 2. Test cluster health using Helm test. $ helm test elasticsearch --cleanup elasticsearch已经安装好了。
[root@k8scloude1 elasticsearch]# helm ls NAME NAMESPACE REVISION UPDATED STATUS CHART APP VERSION elasticsearch helm 1 2022-03-17 11:09:05.996472752 +0800 CST deployed elasticsearch-7.9.1 7.9.1 查看pod,对应的pod也启动起来了。
[root@k8scloude1 elasticsearch]# kubectl get pod NAME READY STATUS RESTARTS AGE elasticsearch-master-0 1/1 Running 0 3m52s elasticsearch-master-1 1/1 Running 0 3m52s 接下来安装filebeat,解压filebeat。
[root@k8scloude1 elasticsearch]# cd ../ [root@k8scloude1 efk]# pwd /root/efk [root@k8scloude1 efk]# ls elasticsearch elasticsearch-7.9.1.tgz filebeat-7.9.1.tgz kibana-7.9.1.tgz metricbeat-7.9.1.tgz [root@k8scloude1 efk]# tar xf filebeat-7.9.1.tgz [root@k8scloude1 efk]# ls elasticsearch elasticsearch-7.9.1.tgz filebeat filebeat-7.9.1.tgz kibana-7.9.1.tgz metricbeat-7.9.1.tgz 所需镜像版本要修改一致,filebeat/values.yaml 文件除了镜像版本,其他的不需要修改。
[root@k8scloude1 efk]# cd filebeat/ [root@k8scloude1 filebeat]# ls Chart.yaml examples Makefile README.md templates values.yaml [root@k8scloude1 filebeat]# grep image values.yaml # image: busybox # image: busybox image: "docker.elastic.co/beats/filebeat" imageTag: "7.9.1" imagePullPolicy: "IfNotPresent" imagePullSecrets: [] 安装filebeat。
[root@k8scloude1 filebeat]# cd ../ [root@k8scloude1 efk]# ls elasticsearch elasticsearch-7.9.1.tgz filebeat filebeat-7.9.1.tgz kibana-7.9.1.tgz metricbeat-7.9.1.tgz [root@k8scloude1 efk]# helm install filebeat filebeat W0317 11:18:05.080789 42502 warnings.go:70] rbac.authorization.k8s.io/v1beta1 ClusterRole is deprecated in v1.17+, unavailable in v1.22+; use rbac.authorization.k8s.io/v1 ClusterRole W0317 11:18:05.082311 42502 warnings.go:70] rbac.authorization.k8s.io/v1beta1 ClusterRoleBinding is deprecated in v1.17+, unavailable in v1.22+; use rbac.authorization.k8s.io/v1 ClusterRoleBinding W0317 11:18:05.120788 42502 warnings.go:70] rbac.authorization.k8s.io/v1beta1 ClusterRole is deprecated in v1.17+, unavailable in v1.22+; use rbac.authorization.k8s.io/v1 ClusterRole W0317 11:18:05.126392 42502 warnings.go:70] rbac.authorization.k8s.io/v1beta1 ClusterRoleBinding is deprecated in v1.17+, unavailable in v1.22+; use rbac.authorization.k8s.io/v1 ClusterRoleBinding NAME: filebeat LAST DEPLOYED: Thu Mar 17 11:18:04 2022 NAMESPACE: helm STATUS: deployed REVISION: 1 TEST SUITE: None NOTES: 1. Watch all containers come up. $ kubectl get pods --namespace=helm -l app=filebeat-filebeat -w filebeat的pod也启动起来了。
[root@k8scloude1 efk]# kubectl get pods -o wide NAME READY STATUS RESTARTS AGE IP NODE NOMINATED NODE READINESS GATES elasticsearch-master-0 1/1 Running 0 18m 10.244.112.159 k8scloude2 <none> <none> elasticsearch-master-1 1/1 Running 0 18m 10.244.251.246 k8scloude3 <none> <none> filebeat-filebeat-5wl4j 1/1 Running 0 9m57s 10.244.112.161 k8scloude2 <none> <none> filebeat-filebeat-lkxxc 1/1 Running 0 9m57s 10.244.251.247 k8scloude3 <none> <none> 解压metricbeat。
[root@k8scloude1 efk]# tar xf metricbeat-7.9.1.tgz [root@k8scloude1 efk]# ls elasticsearch elasticsearch-7.9.1.tgz filebeat filebeat-7.9.1.tgz kibana-7.9.1.tgz metricbeat metricbeat-7.9.1.tgz 修改values.yaml文件,所需镜像版本要修改一致。
[root@k8scloude1 efk]# cd metricbeat/ [root@k8scloude1 metricbeat]# ls charts Chart.yaml examples Makefile README.md requirements.lock requirements.yaml templates values.yaml [root@k8scloude1 metricbeat]# grep image values.yaml # - Filesystem group for the metricbeat user. The official elastic docker images always have an id of 1000. # image: busybox # image: busybox image: "docker.elastic.co/beats/metricbeat" imageTag: "7.9.1" imagePullPolicy: "IfNotPresent" imagePullSecrets: [] 安装metricbeat。
[root@k8scloude1 metricbeat]# cd ../ [root@k8scloude1 efk]# ls elasticsearch elasticsearch-7.9.1.tgz filebeat filebeat-7.9.1.tgz kibana-7.9.1.tgz metricbeat metricbeat-7.9.1.tgz #安装metricbeat [root@k8scloude1 efk]# helm install metricbeat metricbeat W0317 11:31:18.599946 52640 warnings.go:70] rbac.authorization.k8s.io/v1beta1 ClusterRole is deprecated in v1.17+, unavailable in v1.22+; use rbac.authorization.k8s.io/v1 ClusterRole W0317 11:31:18.601822 52640 warnings.go:70] rbac.authorization.k8s.io/v1beta1 ClusterRole is deprecated in v1.17+, unavailable in v1.22+; use rbac.authorization.k8s.io/v1 ClusterRole W0317 11:31:18.603664 52640 warnings.go:70] rbac.authorization.k8s.io/v1beta1 ClusterRoleBinding is deprecated in v1.17+, unavailable in v1.22+; use rbac.authorization.k8s.io/v1 ClusterRoleBinding W0317 11:31:18.605592 52640 warnings.go:70] rbac.authorization.k8s.io/v1beta1 ClusterRoleBinding is deprecated in v1.17+, unavailable in v1.22+; use rbac.authorization.k8s.io/v1 ClusterRoleBinding W0317 11:31:18.661010 52640 warnings.go:70] rbac.authorization.k8s.io/v1beta1 ClusterRole is deprecated in v1.17+, unavailable in v1.22+; use rbac.authorization.k8s.io/v1 ClusterRole W0317 11:31:18.661128 52640 warnings.go:70] rbac.authorization.k8s.io/v1beta1 ClusterRole is deprecated in v1.17+, unavailable in v1.22+; use rbac.authorization.k8s.io/v1 ClusterRole W0317 11:31:18.669323 52640 warnings.go:70] rbac.authorization.k8s.io/v1beta1 ClusterRoleBinding is deprecated in v1.17+, unavailable in v1.22+; use rbac.authorization.k8s.io/v1 ClusterRoleBinding W0317 11:31:18.671969 52640 warnings.go:70] rbac.authorization.k8s.io/v1beta1 ClusterRoleBinding is deprecated in v1.17+, unavailable in v1.22+; use rbac.authorization.k8s.io/v1 ClusterRoleBinding NAME: metricbeat LAST DEPLOYED: Thu Mar 17 11:31:18 2022 NAMESPACE: helm STATUS: deployed REVISION: 1 TEST SUITE: None NOTES: 1. Watch all containers come up. $ kubectl get pods --namespace=helm -l app=metricbeat-metricbeat -w metricbeat的pod启动起来了。
[root@k8scloude1 efk]# kubectl get pod -o wide NAME READY STATUS RESTARTS AGE IP NODE NOMINATED NODE READINESS GATES elasticsearch-master-0 1/1 Running 0 23m 10.244.112.159 k8scloude2 <none> <none> elasticsearch-master-1 1/1 Running 0 23m 10.244.251.246 k8scloude3 <none> <none> filebeat-filebeat-5wl4j 1/1 Running 0 14m 10.244.112.161 k8scloude2 <none> <none> filebeat-filebeat-lkxxc 1/1 Running 0 14m 10.244.251.247 k8scloude3 <none> <none> metricbeat-kube-state-metrics-75c5fc65d9-jcwz2 1/1 Running 0 55s 10.244.251.216 k8scloude3 <none> <none> metricbeat-metricbeat-metrics-7c5cd7d77f-tr4r4 1/1 Running 0 55s 10.244.112.166 k8scloude2 <none> <none> metricbeat-metricbeat-n62rf 1/1 Running 0 55s 10.244.251.245 k8scloude3 <none> <none> metricbeat-metricbeat-w9m4j 1/1 Running 0 55s 10.244.112.157 k8scloude2 <none> <none> 解压kibana。
[root@k8scloude1 efk]# ls elasticsearch elasticsearch-7.9.1.tgz filebeat filebeat-7.9.1.tgz kibana-7.9.1.tgz metricbeat metricbeat-7.9.1.tgz [root@k8scloude1 efk]# tar xf kibana-7.9.1.tgz [root@k8scloude1 efk]# ls elasticsearch elasticsearch-7.9.1.tgz filebeat filebeat-7.9.1.tgz kibana kibana-7.9.1.tgz metricbeat metricbeat-7.9.1.tgz 把kibana/values.yaml里镜像版本修改一致。
[root@k8scloude1 efk]# grep image kibana/values.yaml image: "docker.elastic.co/kibana/kibana" imageTag: "7.9.1" imagePullPolicy: "IfNotPresent" # image: busybox # image: busybox imagePullSecrets: [] kibana/values.yaml里,service服务的类型为ClusterIP,外界访问不了kibana的web界面,为了方便访问kibana,修改服务的发布类型为NodePort ,修改之后如下:
[root@k8scloude1 efk]# vim kibana/values.yaml [root@k8scloude1 efk]# egrep -A10 'service:' kibana/values.yaml service: type: NodePort loadBalancerIP: "" port: 5601 nodePort: "" labels: {} annotations: {} # cloud.google.com/load-balancer-type: "Internal" # service.beta.kubernetes.io/aws-load-balancer-internal: 0.0.0.0/0 # service.beta.kubernetes.io/azure-load-balancer-internal: "true" # service.beta.kubernetes.io/openstack-internal-load-balancer: "true" 安装kibana。
[root@k8scloude1 efk]# ls elasticsearch elasticsearch-7.9.1.tgz filebeat filebeat-7.9.1.tgz kibana kibana-7.9.1.tgz metricbeat metricbeat-7.9.1.tgz [root@k8scloude1 efk]# helm install kibana kibana NAME: kibana LAST DEPLOYED: Thu Mar 17 11:41:50 2022 NAMESPACE: helm STATUS: deployed REVISION: 1 TEST SUITE: None 查看pod,此时发现kibana-kibana-f88767f86-x4xpk一直处于Pending状态。
[root@k8scloude1 efk]# kubectl get pod -o wide NAME READY STATUS RESTARTS AGE IP NODE NOMINATED NODE READINESS GATES elasticsearch-master-0 1/1 Running 0 33m 10.244.112.159 k8scloude2 <none> <none> elasticsearch-master-1 1/1 Running 0 33m 10.244.251.246 k8scloude3 <none> <none> filebeat-filebeat-5wl4j 1/1 Running 0 24m 10.244.112.161 k8scloude2 <none> <none> filebeat-filebeat-lkxxc 1/1 Running 0 24m 10.244.251.247 k8scloude3 <none> <none> kibana-kibana-f88767f86-x4xpk 0/1 Pending 0 64s <none> <none> <none> <none> metricbeat-kube-state-metrics-75c5fc65d9-jcwz2 1/1 Running 0 11m 10.244.251.216 k8scloude3 <none> <none> metricbeat-metricbeat-metrics-7c5cd7d77f-tr4r4 1/1 Running 0 11m 10.244.112.166 k8scloude2 <none> <none> metricbeat-metricbeat-n62rf 1/1 Running 0 11m 10.244.251.245 k8scloude3 <none> <none> metricbeat-metricbeat-w9m4j 1/1 Running 0 11m 10.244.112.157 k8scloude2 <none> <none> 查找问题原因,发现两个原因:
- 原因1是:1 node(s) had taint {node-role.kubernetes.io/master,k8s集群的master节点默认有污点,不能把pod调度到master上;
- 原因2是:2 Insufficient cpu, 2 Insufficient memory. 说明内存CPU不够了。
[root@k8scloude1 ~]# kubectl describe pod kibana-kibana-f88767f86-x4xpk -n helm Name: kibana-kibana-f88767f86-x4xpk Namespace: helm Priority: 0 Node: <none> ...... ConfigMapOptional: <nil> DownwardAPI: true QoS Class: Guaranteed Node-Selectors: <none> Tolerations: node.kubernetes.io/not-ready:NoExecute op=Exists for 300s node.kubernetes.io/unreachable:NoExecute op=Exists for 300s Events: Type Reason Age From Message ---- ------ ---- ---- ------- Warning FailedScheduling 7m37s default-scheduler 0/3 nodes are available: 1 node(s) had taint {node-role.kubernetes.io/master: }, that the pod didn't tolerate, 2 Insufficient cpu, 2 Insufficient memory. Warning FailedScheduling 7m35s default-scheduler 0/3 nodes are available: 1 node(s) had taint {node-role.kubernetes.io/master: }, that the pod didn't tolerate, 2 Insufficient cpu, 2 Insufficient memory. 对于node-role.kubernetes.io/master是污点这个问题,可以把污点去除,使pod能调度到master上,生产环境不推荐这么做,我这里机器配置不多就可以去除master上的污点。关于污点更详细内容请查看博客《pod(九):污点taint 与容忍度tolerations》。
查看所有的污点。
[root@k8scloude1 ~]# kubectl get node -o yaml | grep taint -A 5 taints: - effect: NoSchedule key: node-role.kubernetes.io/master status: addresses: - address: 192.168.110.130 -- taint: T name: k8scloude2 resourceVersion: "2653824" selfLink: /api/v1/nodes/k8scloude2 uid: 618e3885-9918-4c29-b94c-1e074d40fa97 spec: 清除master的污点。
[root@k8scloude1 ~]# kubectl taint nodes --all node-role.kubernetes.io/master- node/k8scloude1 untainted taint "node-role.kubernetes.io/master" not found taint "node-role.kubernetes.io/master" not found [root@k8scloude1 ~]# kubectl get node -o yaml | grep taint -A 5 taint: T name: k8scloude2 resourceVersion: "2654290" selfLink: /api/v1/nodes/k8scloude2 uid: 618e3885-9918-4c29-b94c-1e074d40fa97 spec: 再次查看kibana的pod描述信息,发现污点已经不报错了,现在只剩内存CPU不足报错:2 Insufficient memory, 3 Insufficient cpu。
[root@k8scloude1 ~]# kubectl describe pod kibana-kibana-f88767f86-x4xpk -n helm Name: kibana-kibana-f88767f86-x4xpk Namespace: helm Priority: 0 Node: <none> ...... DownwardAPI: true QoS Class: Guaranteed Node-Selectors: <none> Tolerations: node.kubernetes.io/not-ready:NoExecute op=Exists for 300s node.kubernetes.io/unreachable:NoExecute op=Exists for 300s Events: Type Reason Age From Message ---- ------ ---- ---- ------- Warning FailedScheduling 21m default-scheduler 0/3 nodes are available: 1 node(s) had taint {node-role.kubernetes.io/master: }, that the pod didn't tolerate, 2 Insufficient cpu, 2 Insufficient memory. Warning FailedScheduling 21m default-scheduler 0/3 nodes are available: 1 node(s) had taint {node-role.kubernetes.io/master: }, that the pod didn't tolerate, 2 Insufficient cpu, 2 Insufficient memory. Warning FailedScheduling 29s default-scheduler 0/3 nodes are available: 2 Insufficient memory, 3 Insufficient cpu. 查看k8s的负载。
[root@k8scloude1 efk]# kubectl top nodes W0317 12:23:49.197137 107750 top_node.go:119] Using json format to get metrics. Next release will switch to protocol-buffers, switch early by passing --use-protocol-buffers flag NAME CPU(cores) CPU% MEMORY(bytes) MEMORY% k8scloude1 251m 12% 1717Mi 52% k8scloude2 236m 11% 2485Mi 76% k8scloude3 206m 10% 2535Mi 78% CPU内存不足,最直接的解决办法就是机器加CPU和内存,还可以修改values.yaml 里的资源需求,我把EFK里的所有资源需求都列出来了。
/* elasticsearch 资源要求 resources: requests: cpu: "1000m" memory: "2Gi" limits: cpu: "1000m" memory: "2Gi" filebeat 资源要求 resources: requests: cpu: "100m" memory: "100Mi" limits: cpu: "1000m" memory: "200Mi" kibana资源要求 resources: requests: cpu: "1000m" memory: "2Gi" limits: cpu: "1000m" memory: "2Gi" metricbeat 资源要求 resources: requests: cpu: "100m" memory: "100Mi" limits: cpu: "1000m" memory: "200Mi" tolerations: [] */ 我选择直接添加CPU和内存,重启机器添加CPU和内存之后,查看pod,可以看到EFK的pod都慢慢启动了。
[root@k8scloude1 ~]# kubectl get pod -o wide NAME READY STATUS RESTARTS AGE IP NODE NOMINATED NODE READINESS GATES elasticsearch-master-0 0/1 Running 1 4h13m 10.244.112.165 k8scloude2 <none> <none> elasticsearch-master-1 0/1 Running 1 4h13m 10.244.251.244 k8scloude3 <none> <none> filebeat-filebeat-4gqpl 0/1 Running 1 3h21m 10.244.158.83 k8scloude1 <none> <none> filebeat-filebeat-5wl4j 0/1 Running 1 4h4m 10.244.112.164 k8scloude2 <none> <none> filebeat-filebeat-lkxxc 0/1 Running 1 4h4m 10.244.251.243 k8scloude3 <none> <none> kibana-kibana-f88767f86-x4xpk 0/1 Running 0 3h40m 10.244.158.82 k8scloude1 <none> <none> metricbeat-kube-state-metrics-75c5fc65d9-jcwz2 1/1 Running 1 3h51m 10.244.251.215 k8scloude3 <none> <none> metricbeat-metricbeat-metrics-7c5cd7d77f-tr4r4 0/1 Running 1 3h51m 10.244.112.162 k8scloude2 <none> <none> metricbeat-metricbeat-n62rf 0/1 Running 1 3h51m 10.244.251.252 k8scloude3 <none> <none> metricbeat-metricbeat-nsxwc 0/1 Running 1 3h21m 10.244.158.79 k8scloude1 <none> <none> metricbeat-metricbeat-w9m4j 0/1 Running 1 3h51m 10.244.112.163 k8scloude2 <none> <none> 继续查看kibana的描述信息,查看pod的最新时间,可以看到kibana容器创建成功了,最新的告警Readiness probe failed: Error: Got HTTP code 000 but expected a 200,这是readiness probe探测警告,这个不影响,关于livenessprobe探测和readinessprobe探测详细内容,请查看博客《Kubernetes(k8s)健康性检查:livenessprobe探测和readinessprobe探测 》。
[root@k8scloude1 ~]# kubectl describe pod kibana-kibana-f88767f86-x4xpk -n helm Name: kibana-kibana-f88767f86-x4xpk Namespace: helm Priority: 0 Node: k8scloude1/192.168.110.130 Start Time: Thu, 17 Mar 2022 15:22:01 +0800 ..... Node-Selectors: <none> Tolerations: node.kubernetes.io/not-ready:NoExecute op=Exists for 300s node.kubernetes.io/unreachable:NoExecute op=Exists for 300s Events: Type Reason Age From Message ---- ------ ---- ---- ------- Warning FailedScheduling 3h24m default-scheduler 0/3 nodes are available: 2 Insufficient memory, 3 Insufficient cpu. Normal Scheduled 5m21s default-scheduler Successfully assigned helm/kibana-kibana-f88767f86-x4xpk to k8scloude1 Normal Pulled 5m19s kubelet Container image "docker.elastic.co/kibana/kibana:7.9.1" already present on machine Normal Created 5m19s kubelet Created container kibana Normal Started 5m19s kubelet Started container kibana Warning Unhealthy 91s (x22 over 5m1s) kubelet Readiness probe failed: Error: Got HTTP code 000 but expected a 200 现在所有的EFK pod都正常工作了。
[root@k8scloude1 ~]# kubectl get pod -o wide NAME READY STATUS RESTARTS AGE IP NODE NOMINATED NODE READINESS GATES elasticsearch-master-0 1/1 Running 1 4h18m 10.244.112.165 k8scloude2 <none> <none> elasticsearch-master-1 1/1 Running 1 4h18m 10.244.251.244 k8scloude3 <none> <none> filebeat-filebeat-4gqpl 1/1 Running 1 3h26m 10.244.158.83 k8scloude1 <none> <none> filebeat-filebeat-5wl4j 1/1 Running 1 4h9m 10.244.112.164 k8scloude2 <none> <none> filebeat-filebeat-lkxxc 1/1 Running 1 4h9m 10.244.251.243 k8scloude3 <none> <none> kibana-kibana-f88767f86-x4xpk 1/1 Running 0 3h46m 10.244.158.82 k8scloude1 <none> <none> metricbeat-kube-state-metrics-75c5fc65d9-jcwz2 1/1 Running 1 3h56m 10.244.251.215 k8scloude3 <none> <none> metricbeat-metricbeat-metrics-7c5cd7d77f-tr4r4 1/1 Running 1 3h56m 10.244.112.162 k8scloude2 <none> <none> metricbeat-metricbeat-n62rf 1/1 Running 1 3h56m 10.244.251.252 k8scloude3 <none> <none> metricbeat-metricbeat-nsxwc 1/1 Running 1 3h26m 10.244.158.79 k8scloude1 <none> <none> metricbeat-metricbeat-w9m4j 1/1 Running 1 3h56m 10.244.112.163 k8scloude2 <none> <none> 查看svc,kibana的外部访问端口是32053。
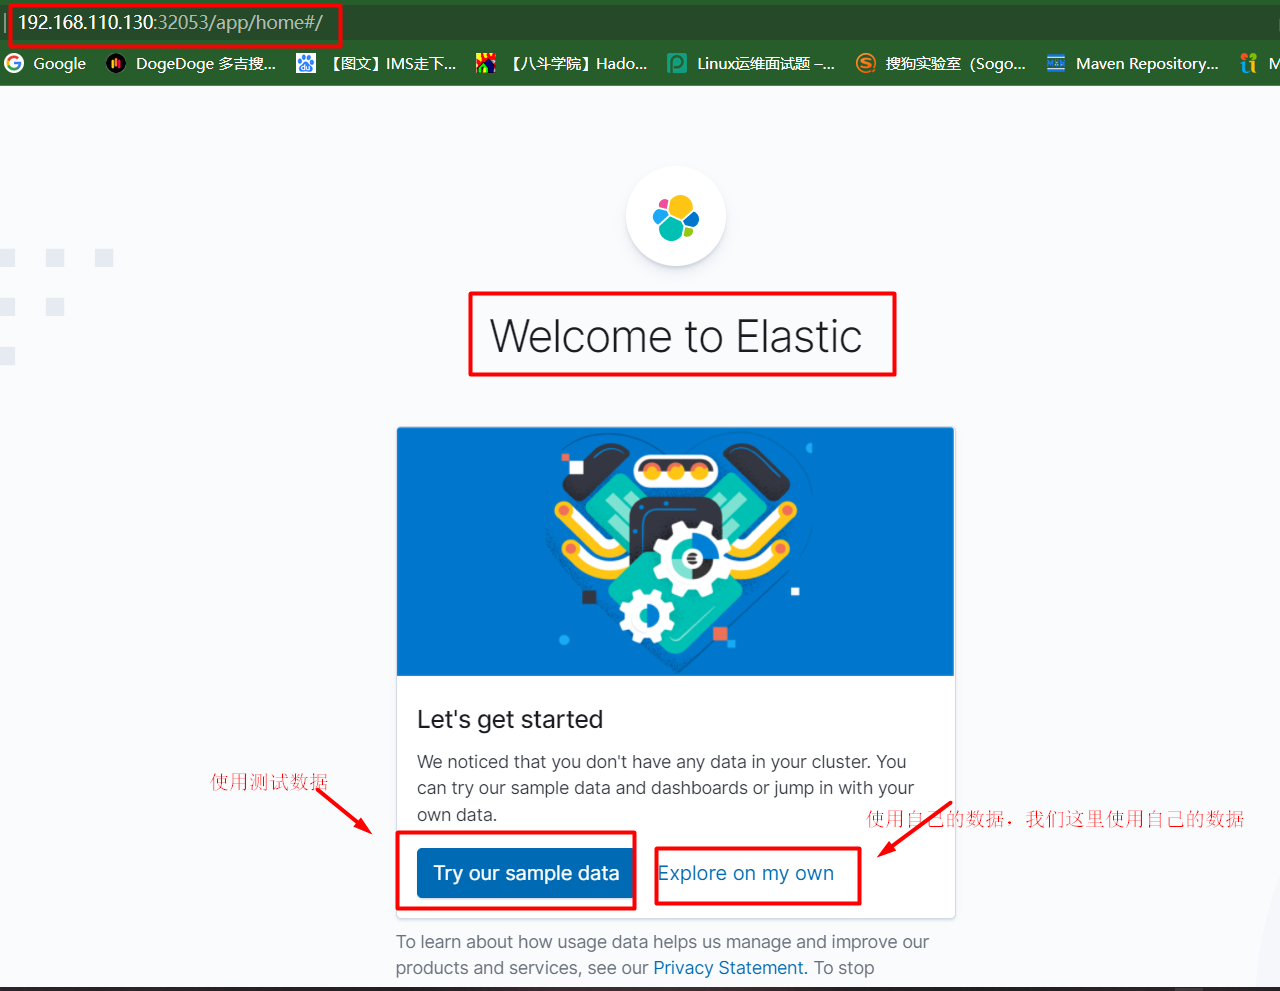
[root@k8scloude1 ~]# kubectl get svc NAME TYPE CLUSTER-IP EXTERNAL-IP PORT(S) AGE elasticsearch-master ClusterIP 10.101.55.37 <none> 9200/TCP,9300/TCP 4h19m elasticsearch-master-headless ClusterIP None <none> 9200/TCP,9300/TCP 4h19m kibana-kibana NodePort 10.103.1.29 <none> 5601:32053/TCP 3h46m metricbeat-kube-state-metrics ClusterIP 10.101.50.89 <none> 8080/TCP 3h57m 五.访问kibana
浏览器访问 http://192.168.110.130:32053/即可查看kibana的web界面。选择Explore on my own导入我们的数据。
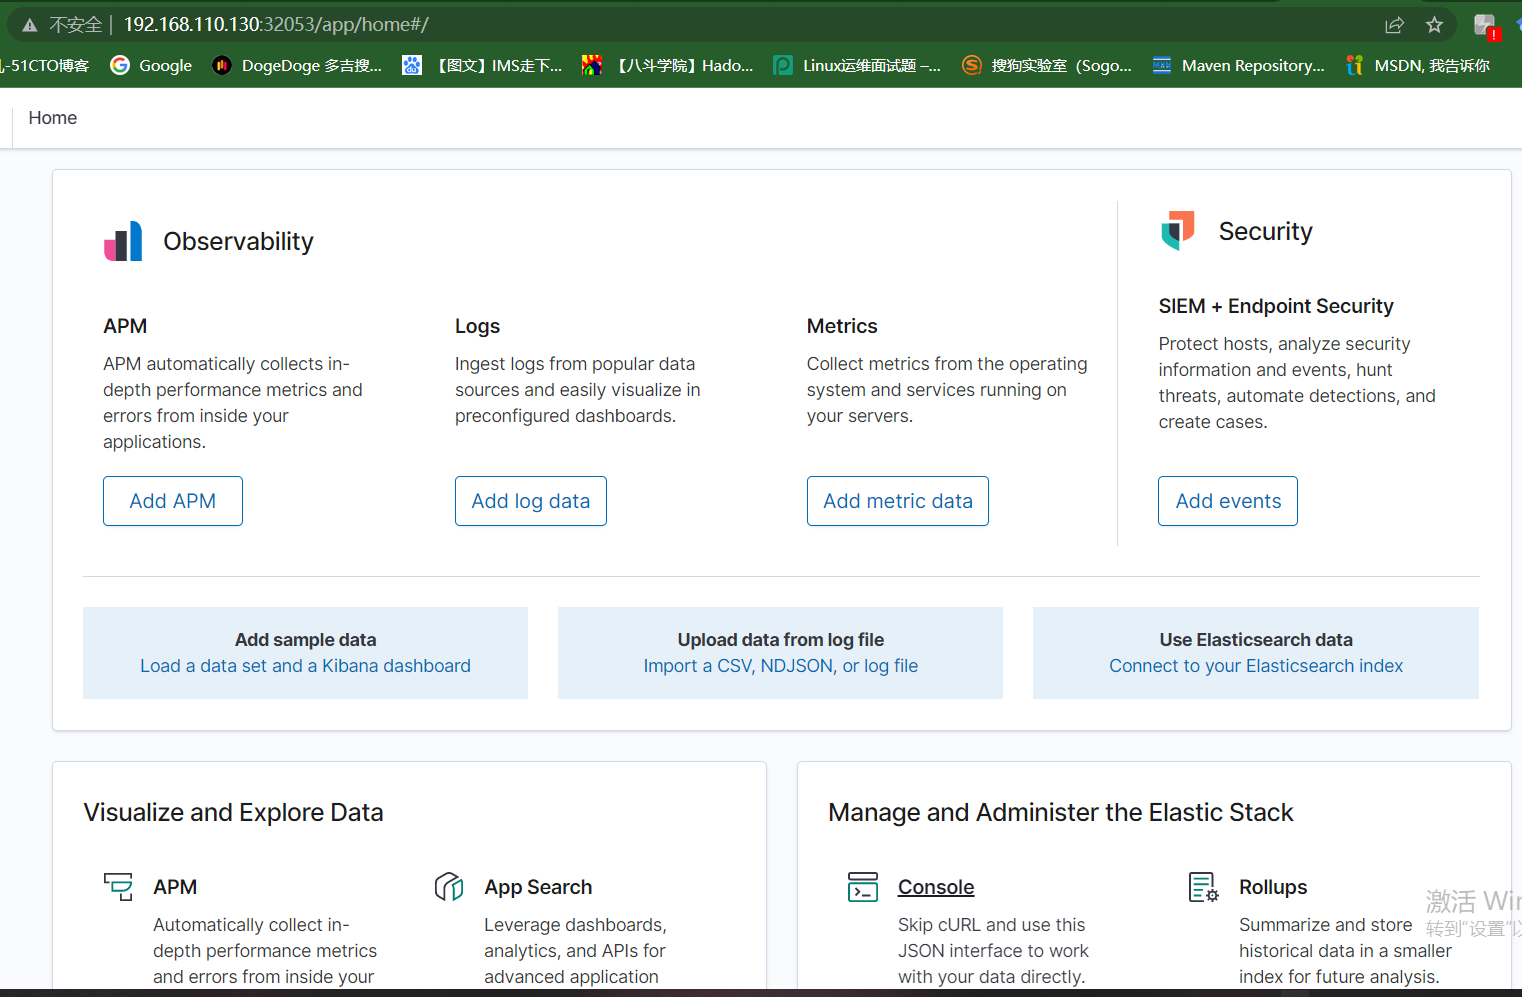
kibana首页如下:
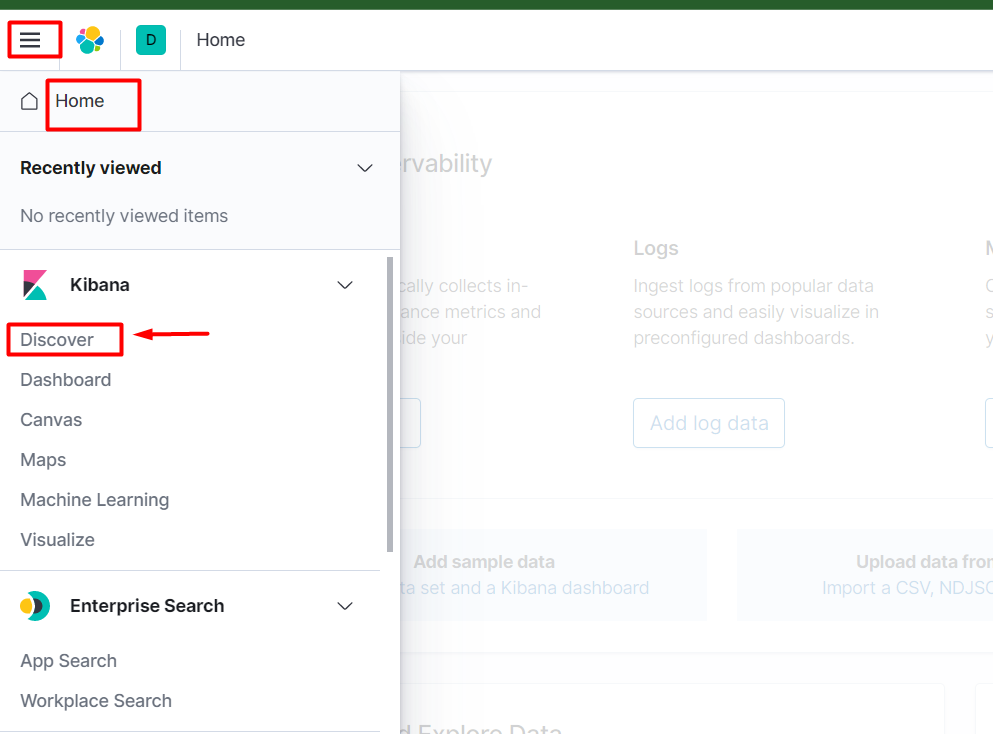
5.1 数据分片
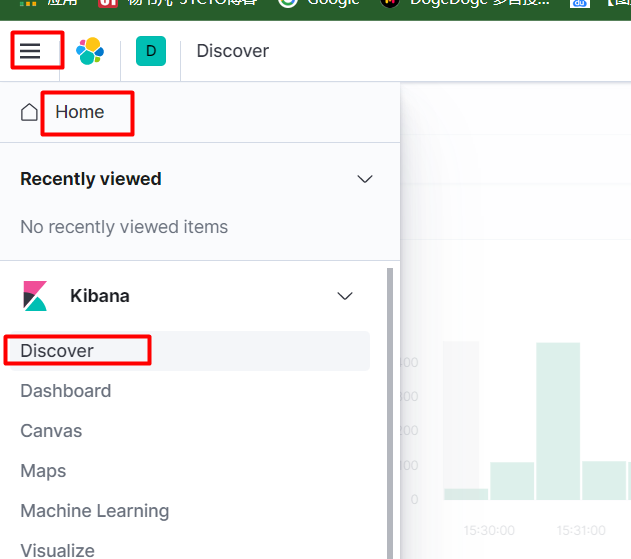
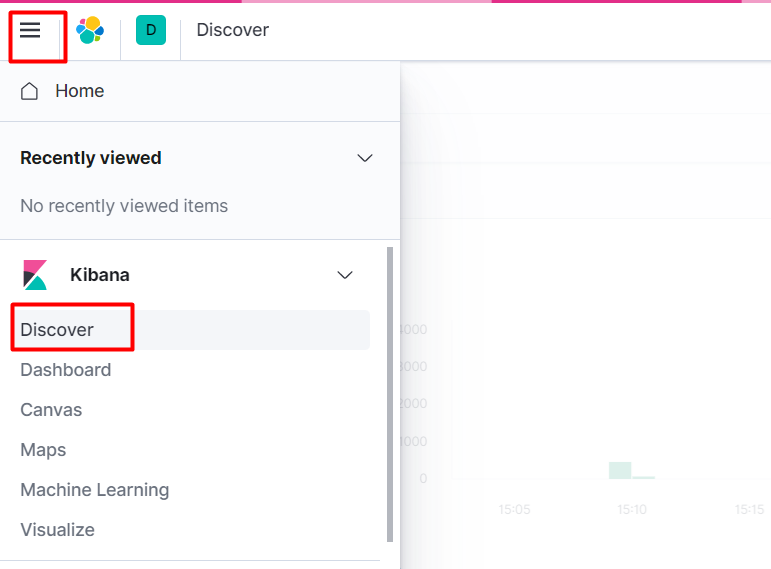
下面进行数据分片,选择Home-->Discover。
点击Create index pattern。
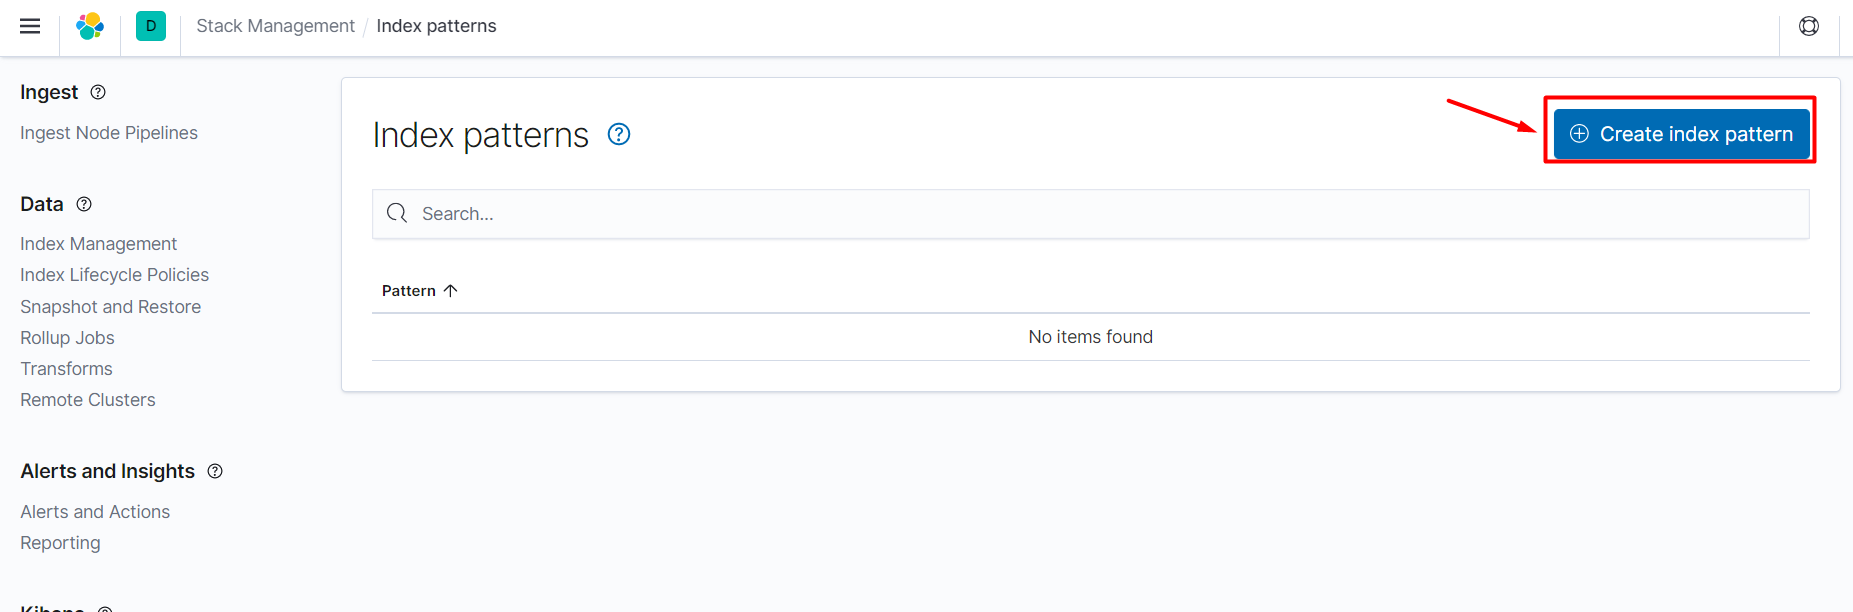
如下为Create index pattern界面。
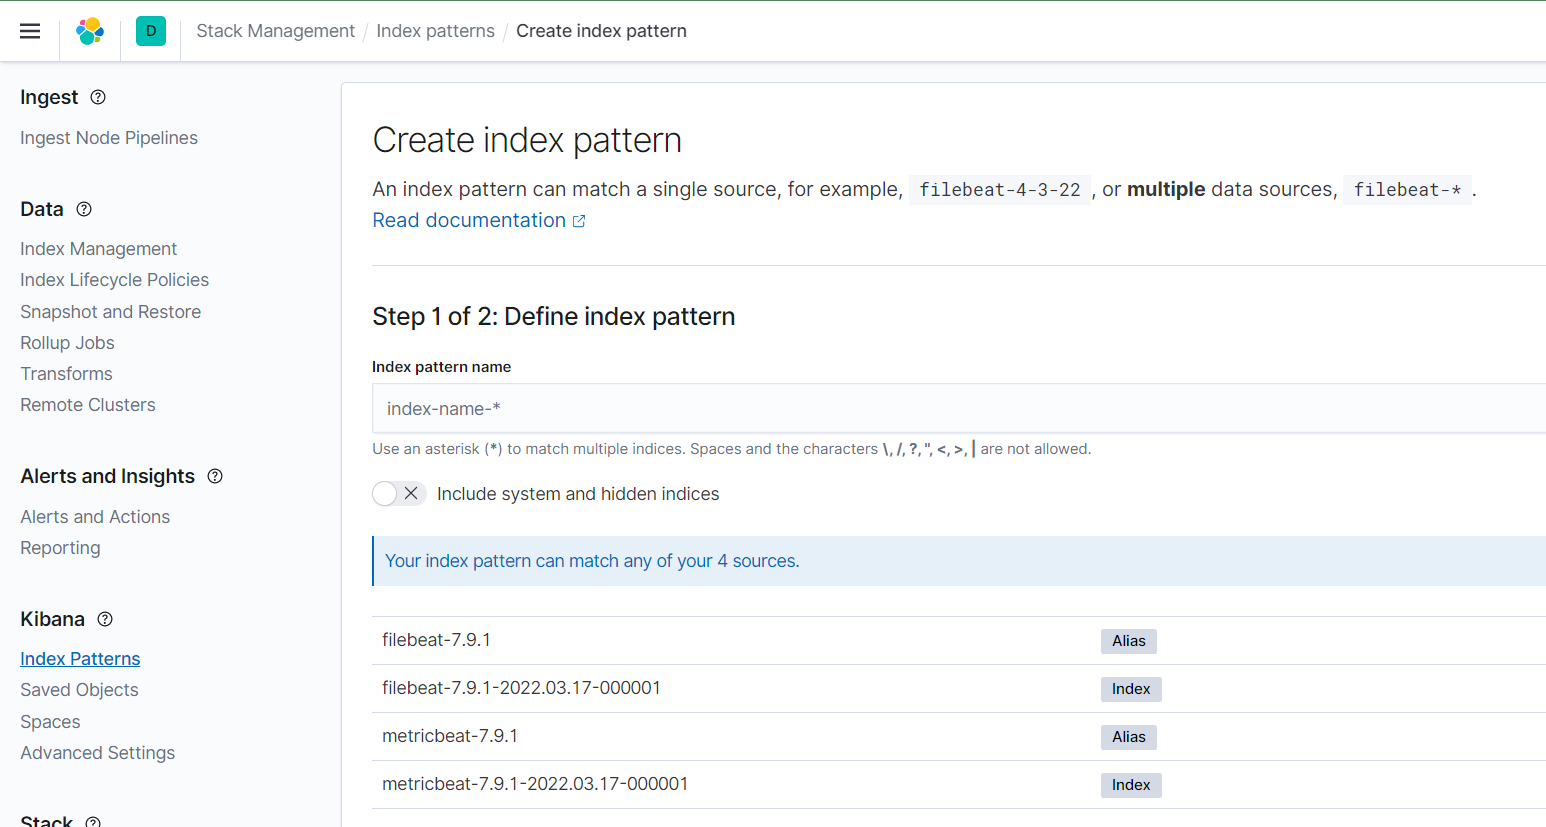
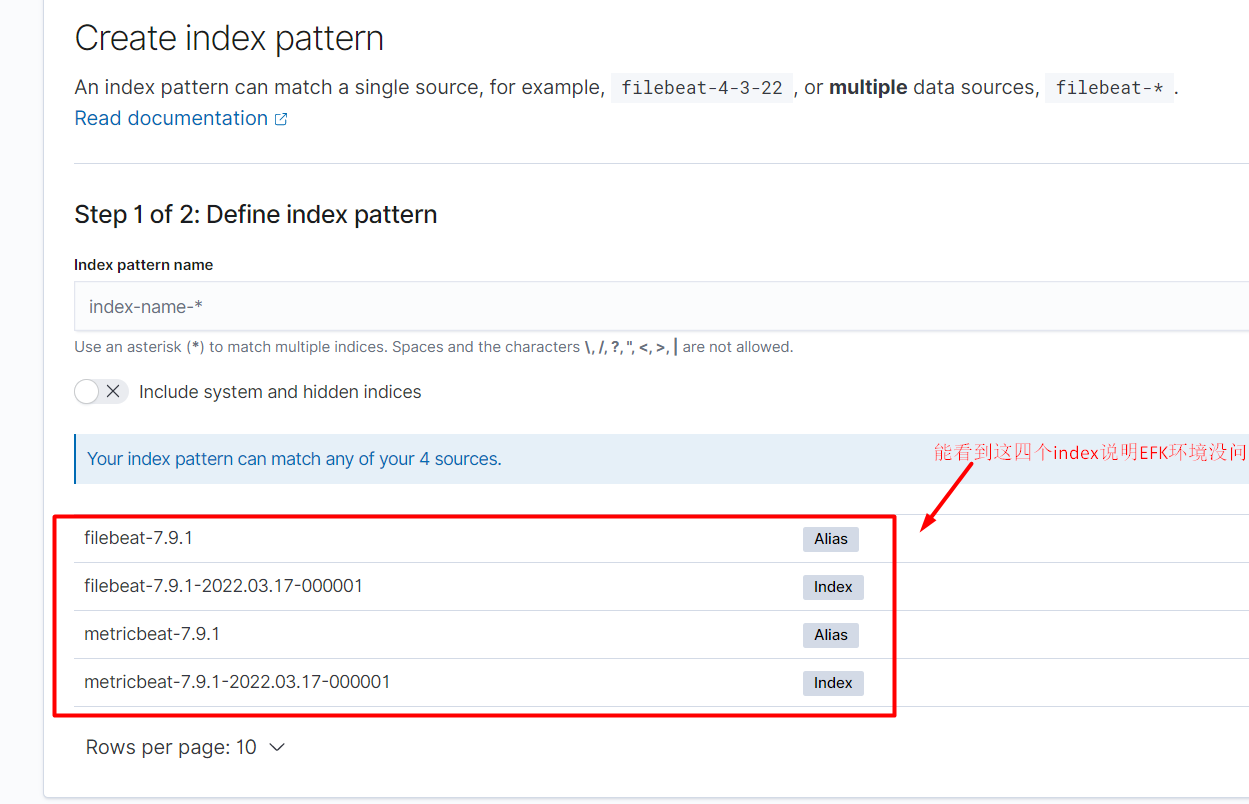
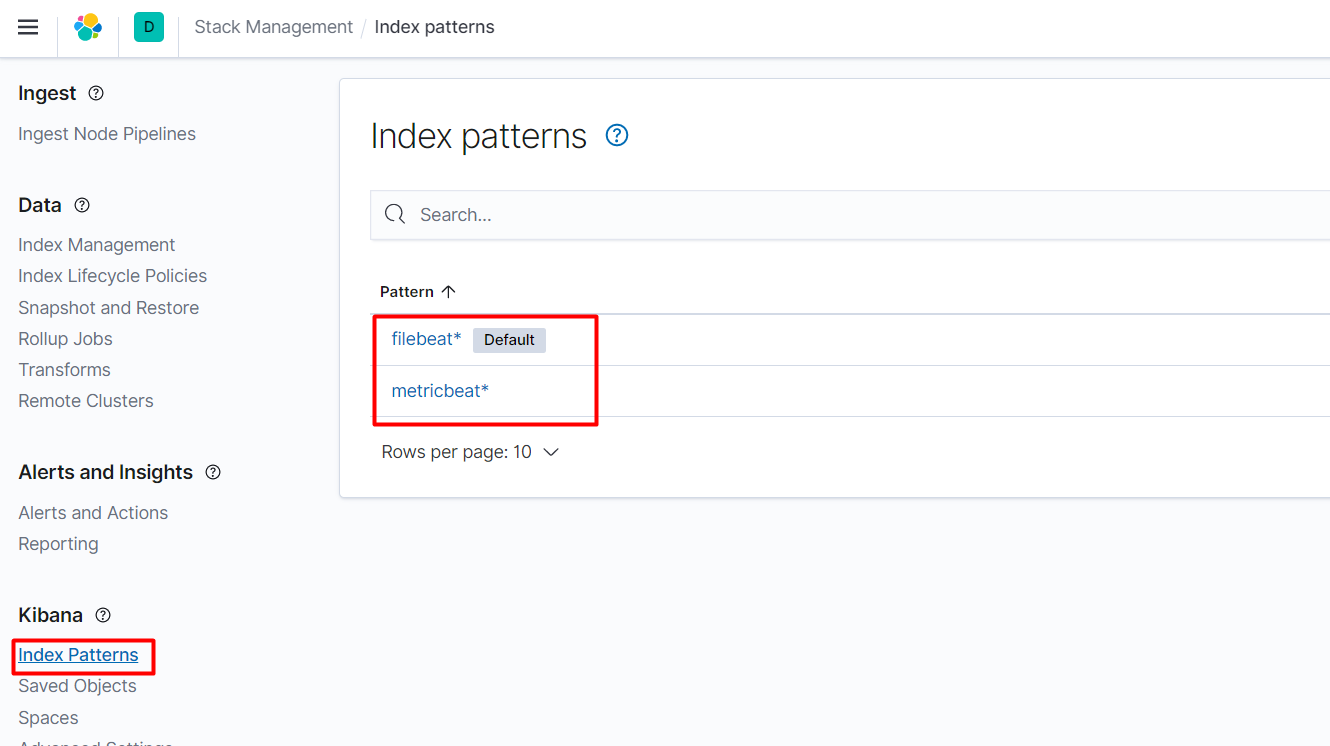
能看到如下四个index说明EFK环境没问题。
选择filebeat,点击下一步。
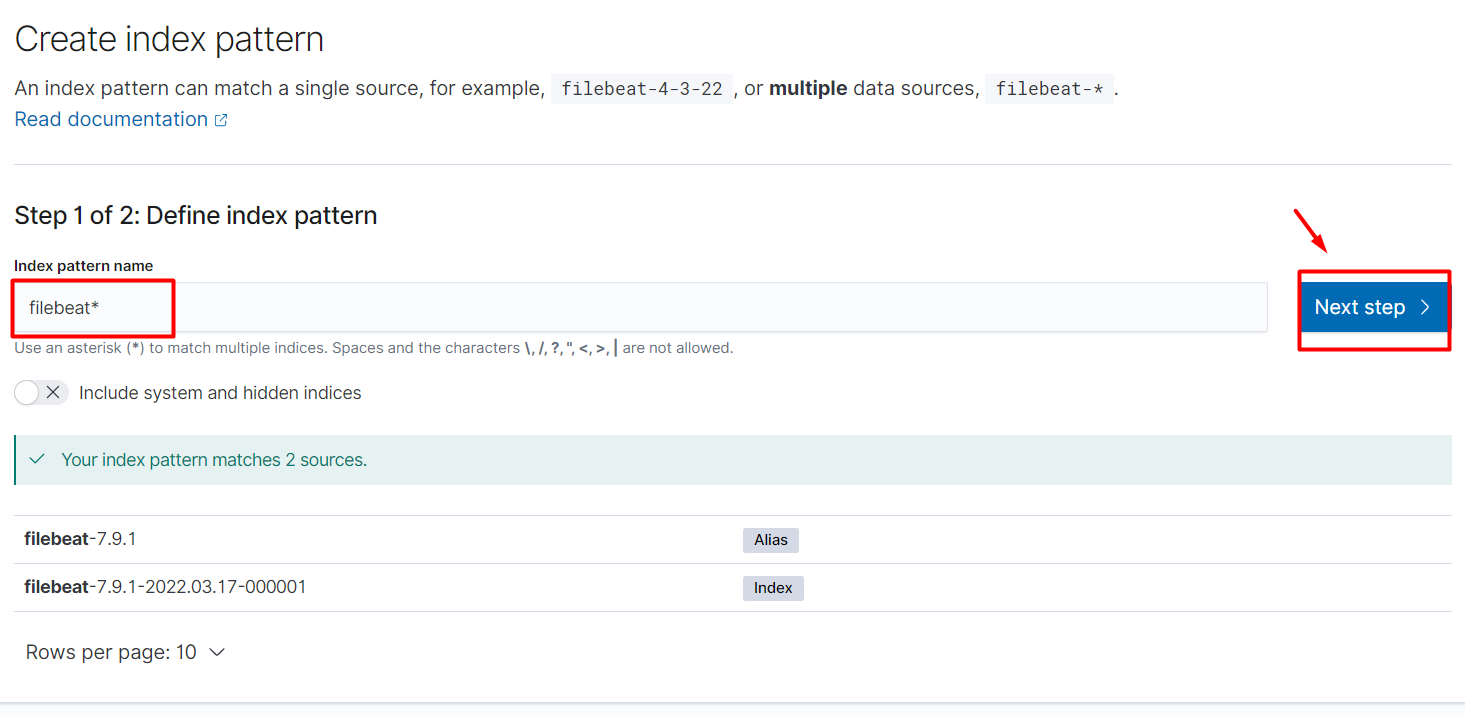
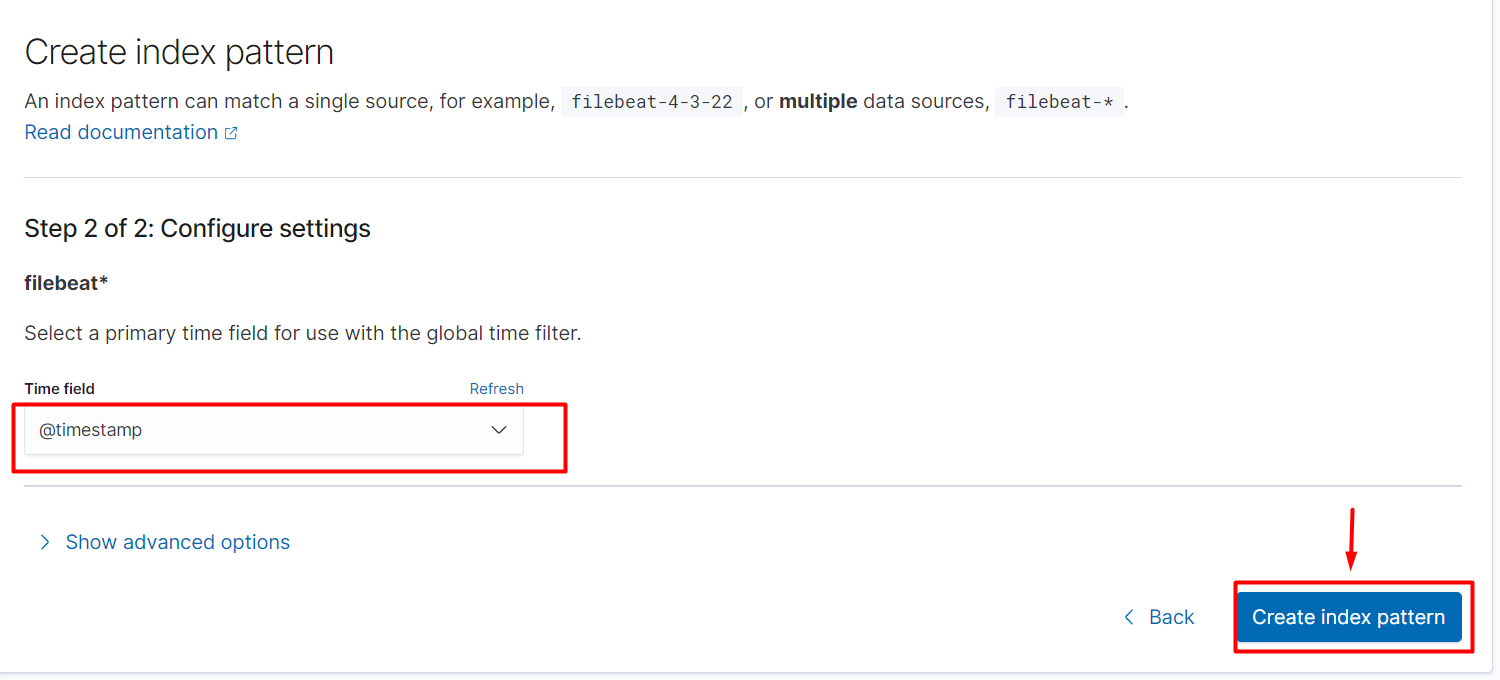
创建索引分区。
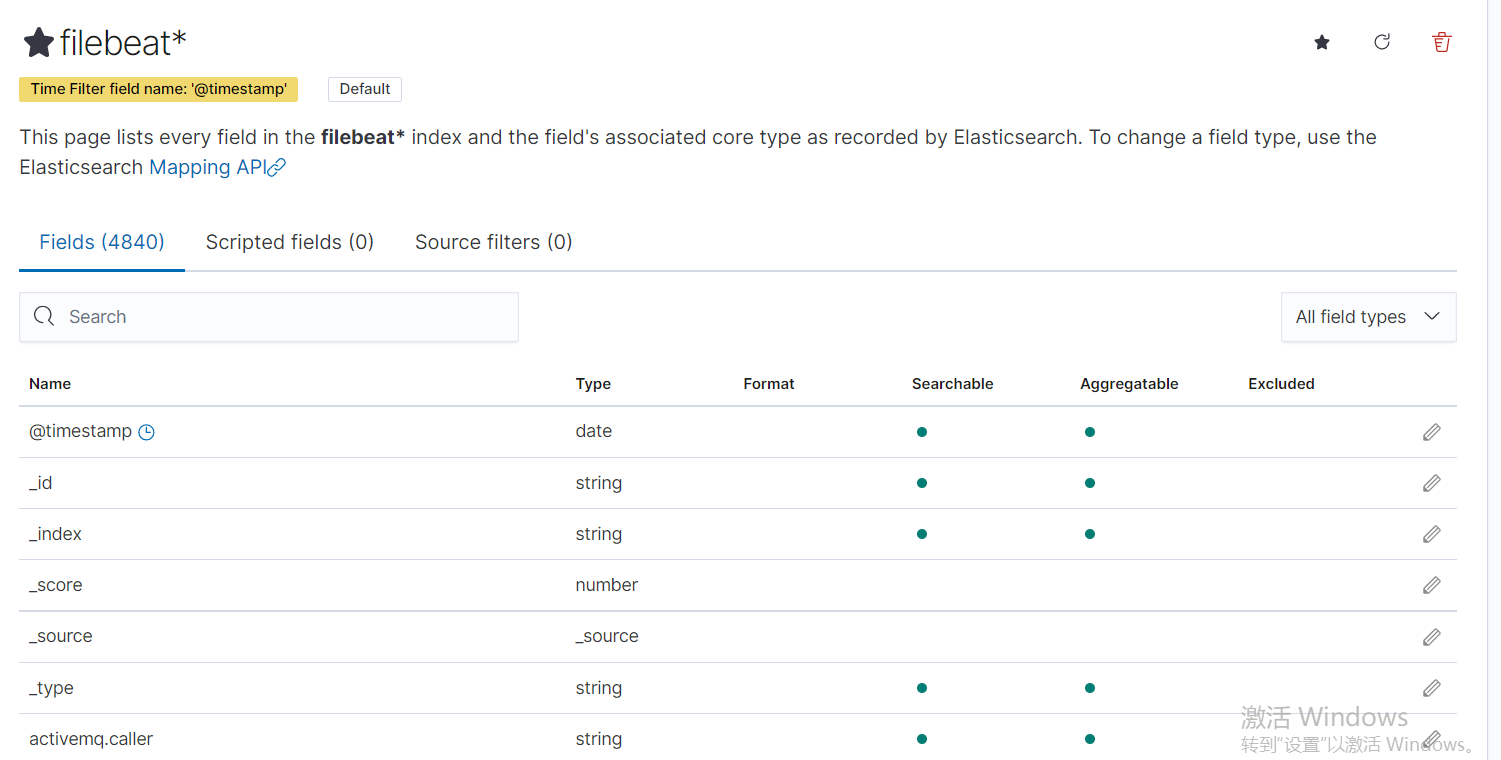
下面是filebeat*的所有字段。
再次点击Home-->Discover。
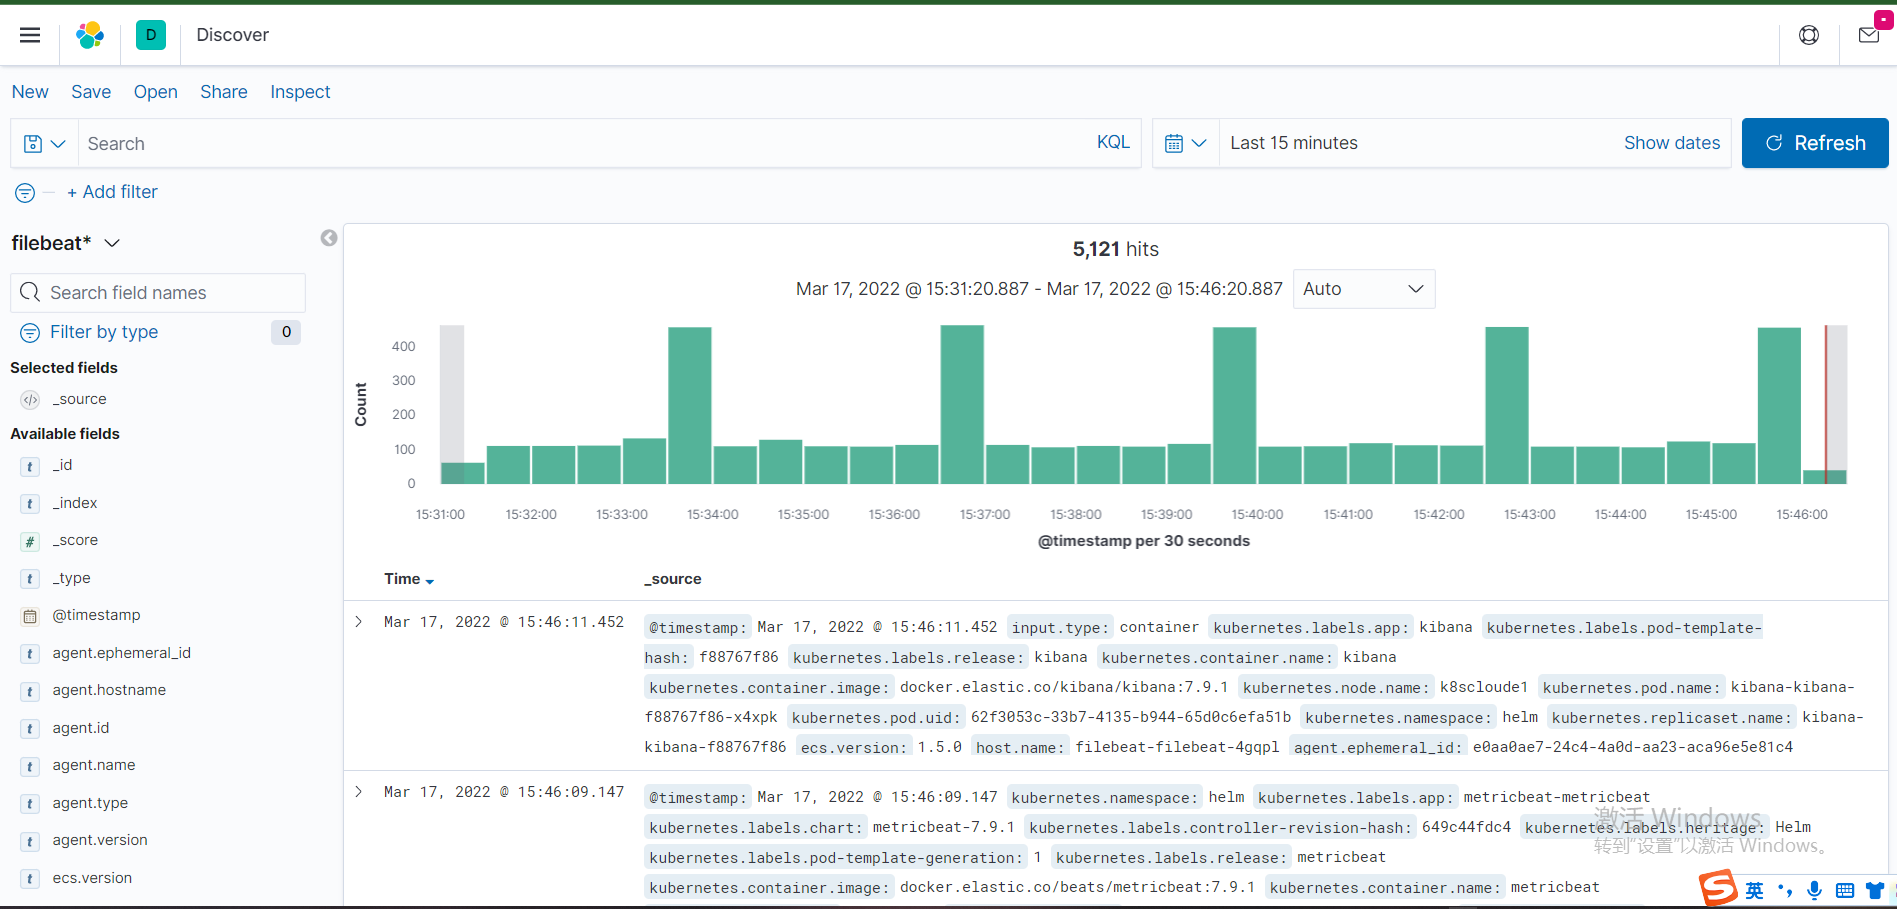
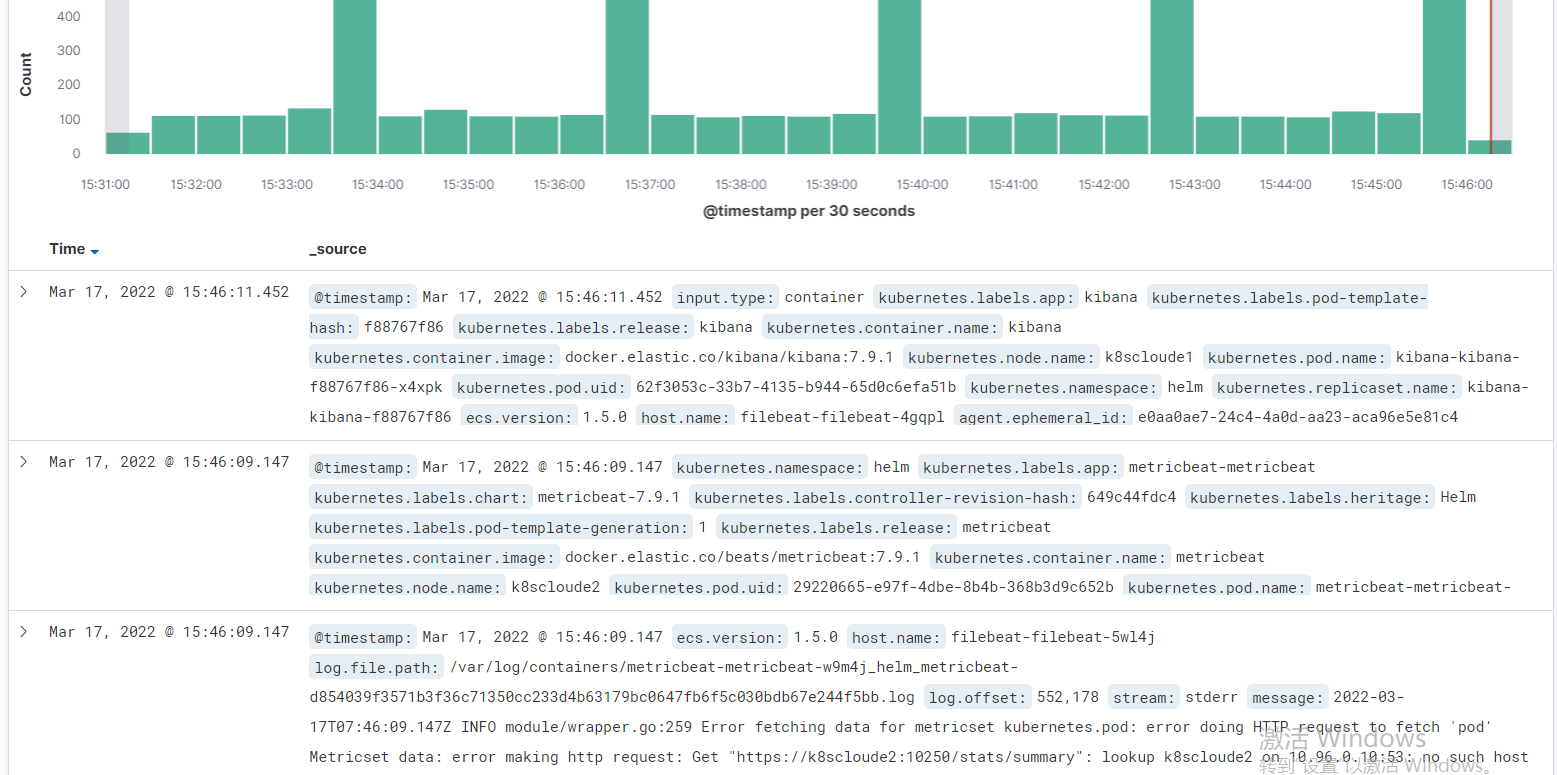
现在就可以看到日志了。
继续Create index pattern。
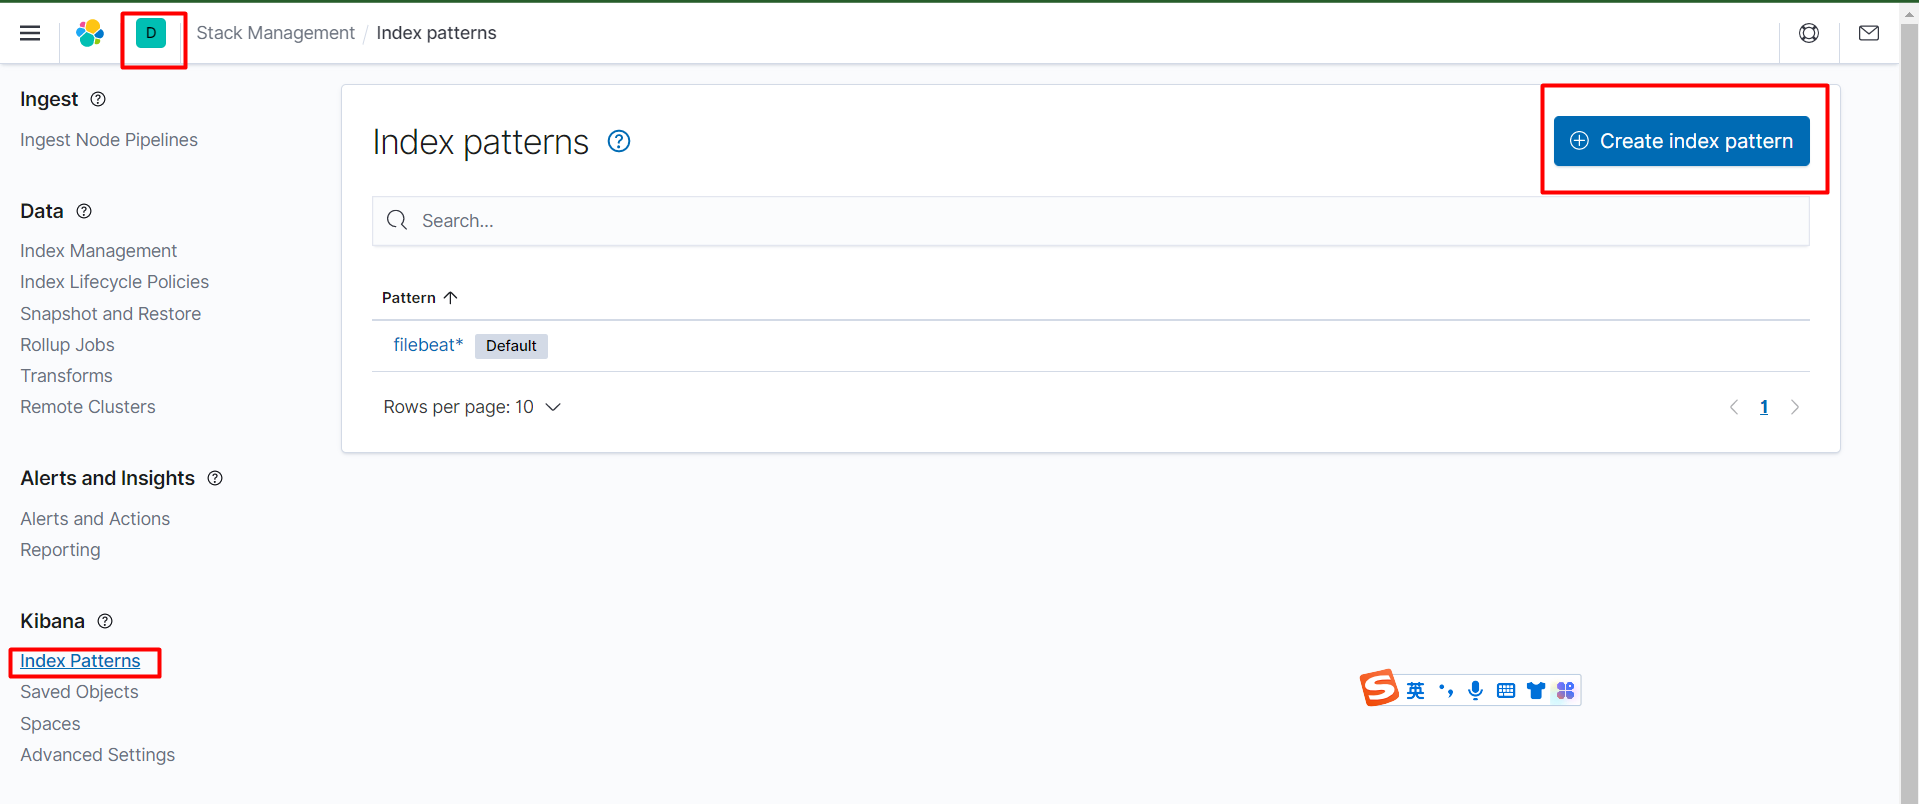
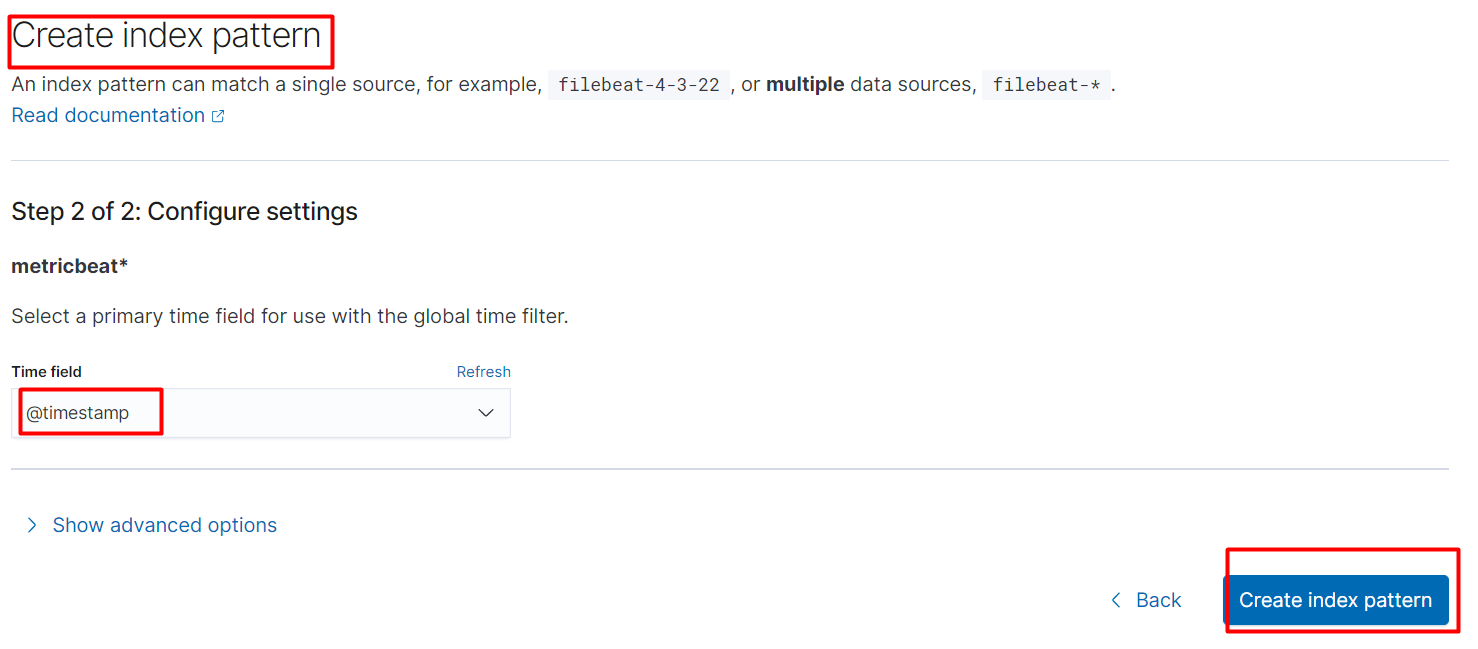
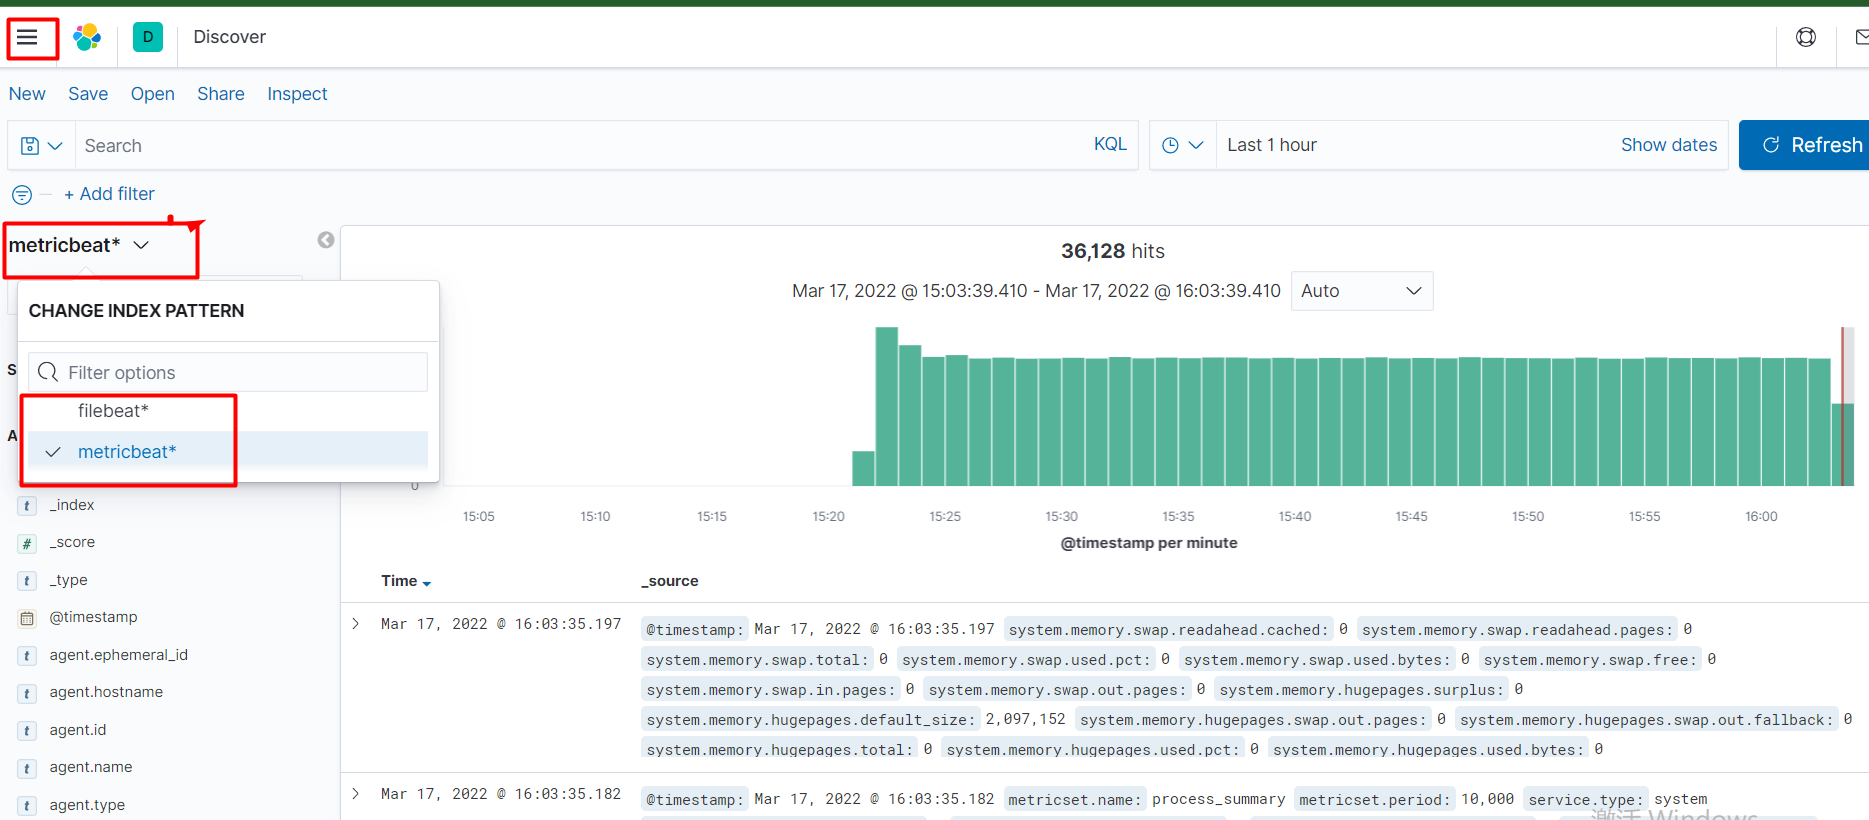
使用相同的方法创建index,选择metricbeat*。
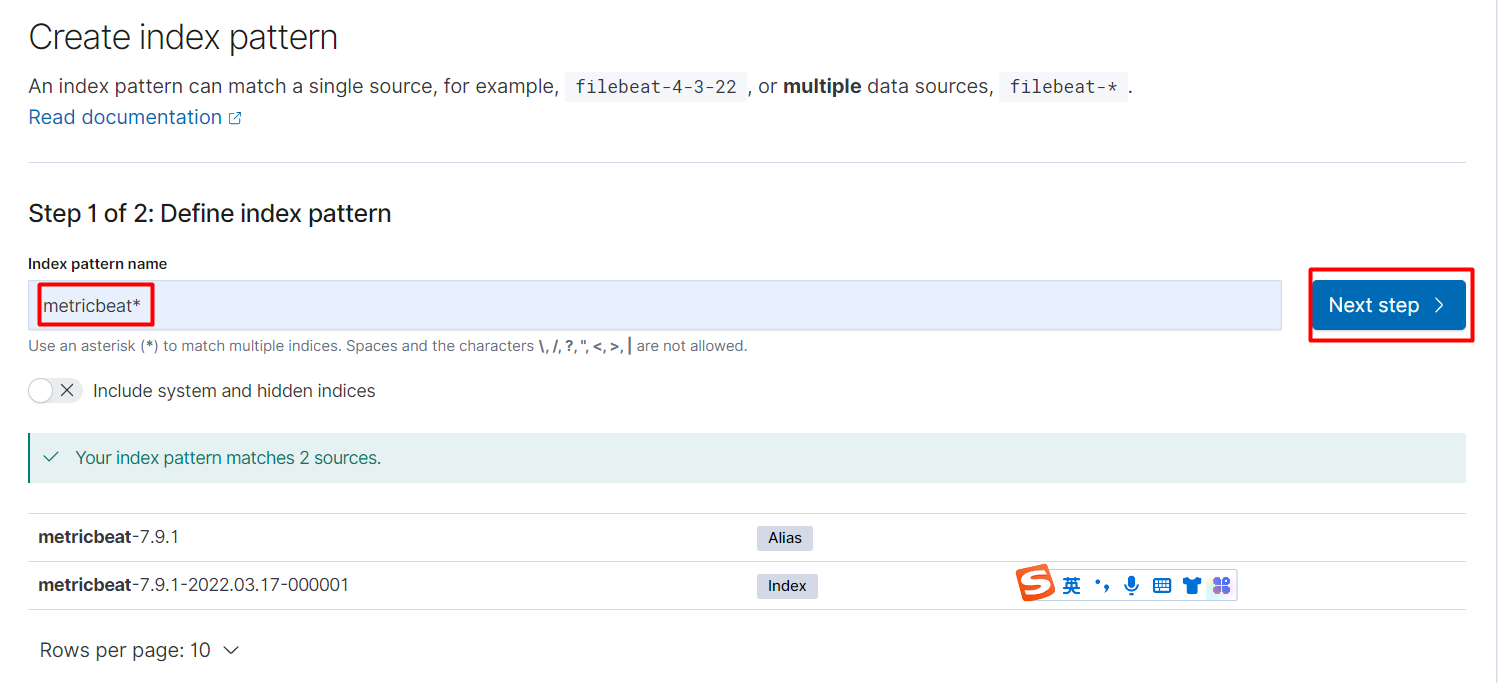
点击Create index pattern。
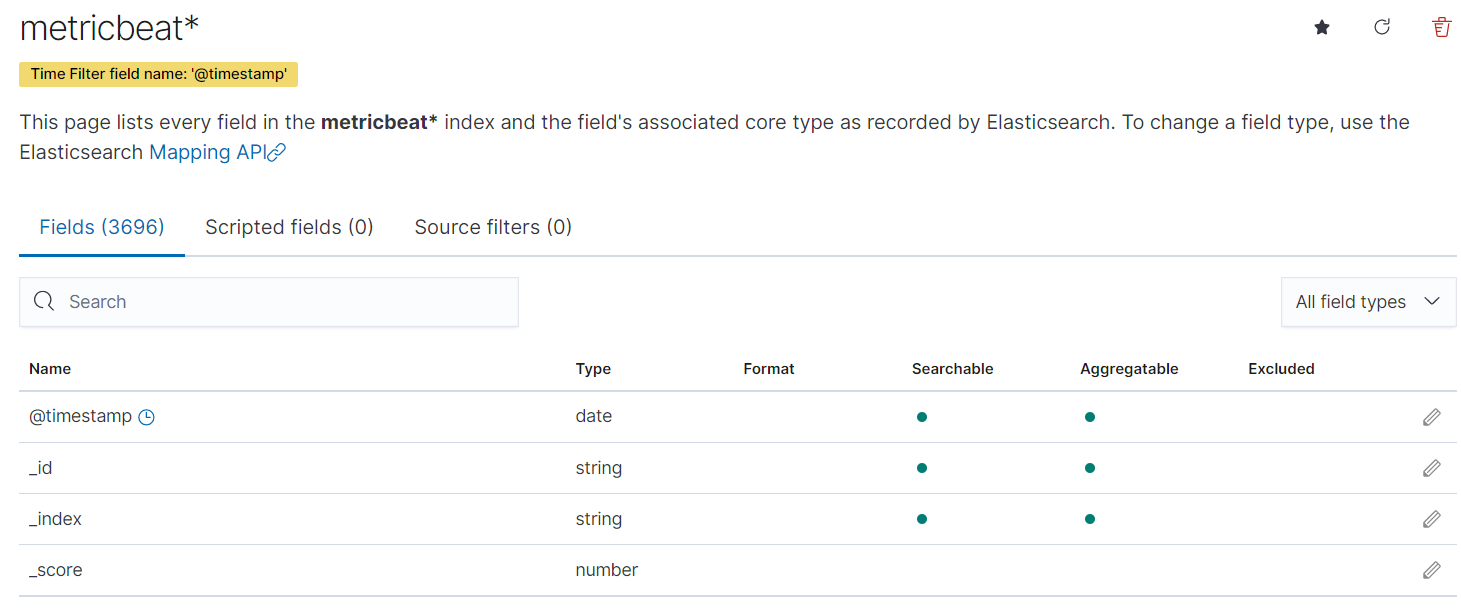
metricbeat*的字段如下。
index patterns默认是filebeat*。
点击Discover。
可以切换查看不同的分区,右边显示的是对应的日志。
自此EFK搭建完毕。
六.卸载EFK
查看helm安装的应用。
[root@k8scloude1 ~]# helm ls NAME NAMESPACE REVISION UPDATED STATUS CHART APP VERSION elasticsearch helm 1 2022-03-17 11:09:05.996472752 +0800 CST deployed elasticsearch-7.9.1 7.9.1 filebeat helm 1 2022-03-17 11:18:04.921145429 +0800 CST deployed filebeat-7.9.1 7.9.1 kibana helm 1 2022-03-17 11:41:50.305787166 +0800 CST deployed kibana-7.9.1 7.9.1 metricbeat helm 1 2022-03-17 11:31:18.353579301 +0800 CST deployed metricbeat-7.9.1 7.9.1 helm删除EFK。
[root@k8scloude1 ~]# helm delete elasticsearch W0317 16:06:49.291827 76335 warnings.go:70] policy/v1beta1 PodDisruptionBudget is deprecated in v1.21+, unavailable in v1.25+; use policy/v1 PodDisruptionBudget release "elasticsearch" uninstalled [root@k8scloude1 ~]# helm delete filebeat W0317 16:07:01.497539 76726 warnings.go:70] rbac.authorization.k8s.io/v1beta1 ClusterRoleBinding is deprecated in v1.17+, unavailable in v1.22+; use rbac.authorization.k8s.io/v1 ClusterRoleBinding W0317 16:07:01.507858 76726 warnings.go:70] rbac.authorization.k8s.io/v1beta1 ClusterRole is deprecated in v1.17+, unavailable in v1.22+; use rbac.authorization.k8s.io/v1 ClusterRole release "filebeat" uninstalled [root@k8scloude1 ~]# helm delete kibana release "kibana" uninstalled [root@k8scloude1 ~]# helm delete metricbeat W0317 16:07:14.955659 77279 warnings.go:70] rbac.authorization.k8s.io/v1beta1 ClusterRoleBinding is deprecated in v1.17+, unavailable in v1.22+; use rbac.authorization.k8s.io/v1 ClusterRoleBinding W0317 16:07:14.955676 77279 warnings.go:70] rbac.authorization.k8s.io/v1beta1 ClusterRoleBinding is deprecated in v1.17+, unavailable in v1.22+; use rbac.authorization.k8s.io/v1 ClusterRoleBinding W0317 16:07:15.014182 77279 warnings.go:70] rbac.authorization.k8s.io/v1beta1 ClusterRole is deprecated in v1.17+, unavailable in v1.22+; use rbac.authorization.k8s.io/v1 ClusterRole W0317 16:07:15.014449 77279 warnings.go:70] rbac.authorization.k8s.io/v1beta1 ClusterRole is deprecated in v1.17+, unavailable in v1.22+; use rbac.authorization.k8s.io/v1 ClusterRole release "metricbeat" uninstalled 删除EFK之后,对应的pod和svc都被删除了。
[root@k8scloude1 ~]# helm ls NAME NAMESPACE REVISION UPDATED STATUS CHART APP VERSION [root@k8scloude1 ~]# kubectl get pod No resources found in helm namespace. [root@k8scloude1 ~]# kubectl get svc No resources found in helm namespace. 七.总结
通过本文,我们学会了如何使用Helm在Kubernetes上部署一个日志管理系统EFK。我们使用Helm安装了Elasticsearch、Fluentd和Kibana,访问了Kibana的Web界面,进行数据分片,最后看到了源源不断的日志。
本文给出的例子仅仅是EFK日志管理系统的一个基本配置,实际上可以根据需求进行进一步的定制和扩展。例如,需要更高级的数据可视化功能,可以将Grafana集成到EFK日志管理系统中;另外,在部署EFK时需要注意一些安全性问题,比如需要在Elasticsearch中设置访问控制等。


![洛谷 P11345 [KTSC 2023 R2] 基地简化 题解](http://www.itfaba.com/wp-content/themes/kemi/timthumb.php?src=http://www.itfaba.com/wp-content/themes/kemi/img/random/1.jpg&w=218&h=124&zc=1)
