OpenTelemetry
OpenTelemetry 是各类 API、SDK 和工具形成的集合。可用于插桩、生成、采集和导出遥测数据(链路、指标和日志),帮助你分析软件的性能和行为。

VKProxy 已集成OpenTelemetry,所以现在可以非常简单采集和导出遥测数据(链路、指标和日志)。
简单回顾asp.net core中如何使用
遥测数据分为链路、指标和日志 ,dotnet中使用可参考OpenTelemetry文档
简单的示例
using Microsoft.Extensions.Options; using OpenTelemetry; using OpenTelemetry.Resources; using OpenTelemetry.Trace; Environment.SetEnvironmentVariable("OTEL_EXPORTER_OTLP_ENDPOINT", "http://127.0.0.1:4317/"); // 配置OpenTelemetry收集器 var builder = WebApplication.CreateBuilder(args); // Add services to the container. builder.Services.AddControllers(); // Learn more about configuring OpenAPI at https://aka.ms/aspnet/openapi builder.Services.AddOpenApi(); builder.Services.AddOpenTelemetry() .ConfigureResource(resource => resource.AddService("TestApi", "").AddContainerDetector()) .WithTracing(tracing => tracing.AddAspNetCoreInstrumentation()) .WithMetrics(builder => { builder.AddMeter("System.Runtime", "Microsoft.AspNetCore.Server.Kestrel", "Microsoft.AspNetCore.MemoryPool"); }) .WithLogging() .UseOtlpExporter(); // 示例使用 Otlp协议 var app = builder.Build(); // Configure the HTTP request pipeline. if (app.Environment.IsDevelopment()) { app.MapOpenApi(); } app.UseHttpsRedirection(); app.UseAuthorization(); app.MapControllers(); app.Run(); 日志
这个其实没什么特别,由于已经提供非常抽象的 ILogger, 所以只需大家按照自己记录log所需正常使用就好,
log 大家使用非常多,这里就不详细示例了,可参考文档Logging in .NET and ASP.NET Core
而OpenTelemetry 对于log,主要是如何在log 结构化并记录分布式追踪的信息,以方便关联。
OpenTelemetry sdk 已经内置支持,只需配置好 .WithLogging(),对应log和分布式追踪的信息都会写入收集器中。
指标
dotnet 中已提供统一的抽象 Meter, 大家不必再关注是为 Prometheus 还是其他方案提供对应性能指标方案
详细文档可参考ASP.NET Core 指标 和 ASP.NET 核心内置指标
这里举个简单例子说明 如何自定义指标
public class ProxyMetrics { private readonly Meter? metrics; private readonly Counter<long>? requestsCounter; private readonly Histogram<double>? requestDuration; public ProxyMetrics(IMeterFactory meterFactory) { var f = serviceProvider.GetService<IMeterFactory>(); metrics = f == null ? null : f.Create("VKProxy.ReverseProxy"); if (metrics != null) { // 计数器 requestsCounter = metrics.CreateCounter<long>("vkproxy.requests", unit: "{request}", "Total number of (HTTP/tcp/udp) requests processed by the reverse proxy."); // 直方图 requestDuration = metrics.CreateHistogram( "vkproxy.request.duration", unit: "s", description: "Proxy handle duration of (HTTP/tcp/udp) requests.", advice: new InstrumentAdvice<double> { HistogramBucketBoundaries = [0.01, 0.02, 0.05, 0.1, 0.2, 0.5, 1, 2, 5, 10, 30, 60, 120, 300] }); } } public void ProxyBegin(IReverseProxyFeature feature) // 在请求开始调用 { string routeId = GetRouteId(feature); GeneralLog.ProxyBegin(generalLogger, routeId); if (requestsCounter != null && requestsCounter.Enabled) { var tags = new TagList { { "route", routeId } // 设置 指标 tag,让其粒度到 route 级别 }; requestsCounter.Add(1, in tags); // +1 记录总共接受了多少个请求 } } public void ProxyEnd(IReverseProxyFeature feature) // 在请求结束调用 { string routeId = GetRouteId(feature); GeneralLog.ProxyEnd(generalLogger, routeId); if (requestDuration != null && requestDuration.Enabled) { var endTimestamp = Stopwatch.GetTimestamp(); var t = Stopwatch.GetElapsedTime(feature.StartTimestamp, endTimestamp); var tags = new TagList { { "route", routeId } // 设置 指标 tag,让其粒度到 route 级别 }; requestDuration.Record(t.TotalSeconds, in tags); // 记录请求耗时 } } } 接着在 Program.cs 中向 DI 注册指标类型:
var builder = WebApplication.CreateBuilder(args); builder.Services.AddSingleton<ProxyMetrics>(); 然后在具体地方使用
private async Task DoHttp(HttpContext context, ListenEndPointOptions? options) { try { logger.ProxyBegin(proxyFeature); ///...... } finally { logger.ProxyEnd(proxyFeature); } } 链路
对于分布式链路追踪,其实dotnet现在已有内置抽象 Activity
这里举个简单例子说明 如何自定义链路
在 Program.cs 中向 DI 注册指标类型:
var builder = WebApplication.CreateBuilder(args); builder.Services.TryAddSingleton(sp => new ActivitySource("VKProxy")); builder.Services.TryAddSingleton(DistributedContextPropagator.Current); 使用 Activity 埋点信息
internal class ListenHandler : ListenHandlerBase { internal const string ActivityName = "VKProxy.ReverseProxy"; private readonly DistributedContextPropagator propagator; private readonly ActivitySource activitySource; public ListenHandler(..., DistributedContextPropagator propagator, ActivitySource activitySource) { this.propagator = propagator; this.activitySource = activitySource; } private async Task DoHttp(HttpContext context, ListenEndPointOptions? options) { Activity activity; if (activitySource.HasListeners()) { var headers = context.Request.Headers; Activity.Current = activity = ActivityCreator.CreateFromRemote(activitySource, propagator, headers, static (object? carrier, string fieldName, out string? fieldValue, out IEnumerable<string>? fieldValues) => { fieldValues = default; var headers = (IHeaderDictionary)carrier!; fieldValue = headers[fieldName]; }, ActivityName, ActivityKind.Server, tags: null, links: null, false); } else { activity = null; } if (activity != null) { activity.Start(); context.Features.Set<IHttpActivityFeature>(new HttpActivityFeature(activity)); context.Features.Set<IHttpMetricsTagsFeature>(new HttpMetricsTagsFeature() { Method = context.Request.Method, Protocol = context.Request.Protocol, Scheme = context.Request.Scheme, MetricsDisabled = true, }); activity.DisplayName = $"{context.Request.Method} {context.Request.Path.Value}"; activity.SetTag("http.request.method", context.Request.Method); activity.SetTag("network.protocol.name", "http"); activity.SetTag("url.scheme", context.Request.Scheme); activity.SetTag("url.path", context.Request.Path.Value); activity.SetTag("url.query", context.Request.QueryString.Value); if (ProtocolHelper.TryGetHttpVersion(context.Request.Protocol, out var httpVersion)) { activity.SetTag("network.protocol.version", httpVersion); } activity.SetTag("http.request.host", context.Request.Host); activity.SetTag("http.request.content_type", context.Request.ContentType); var l = context.Request.ContentLength; if (l.HasValue) activity.SetTag("http.request.content_length", l.Value); } try { logger.ProxyBegin(proxyFeature); ///...... } finally { if (activity != null) { var statusCode = context.Response.StatusCode; activity.SetTag("http.response.status_code", statusCode); activity.Stop(); Activity.Current = null; } logger.ProxyEnd(proxyFeature); } } 仪表盘
遥测数据收集到哪儿,用什么展示,业界有各种方案, 比如
- 将 OpenTelemetry 与 OTLP 和独立 Aspire 仪表板配合使用
- 将 OpenTelemetry 与 Prometheus、Grafana 和 Jaeger 结合使用
- 将 OpenTelemetry 与 SkyWalking ui 结合使用
- 等等
大家可以根据自己喜好和实际选择
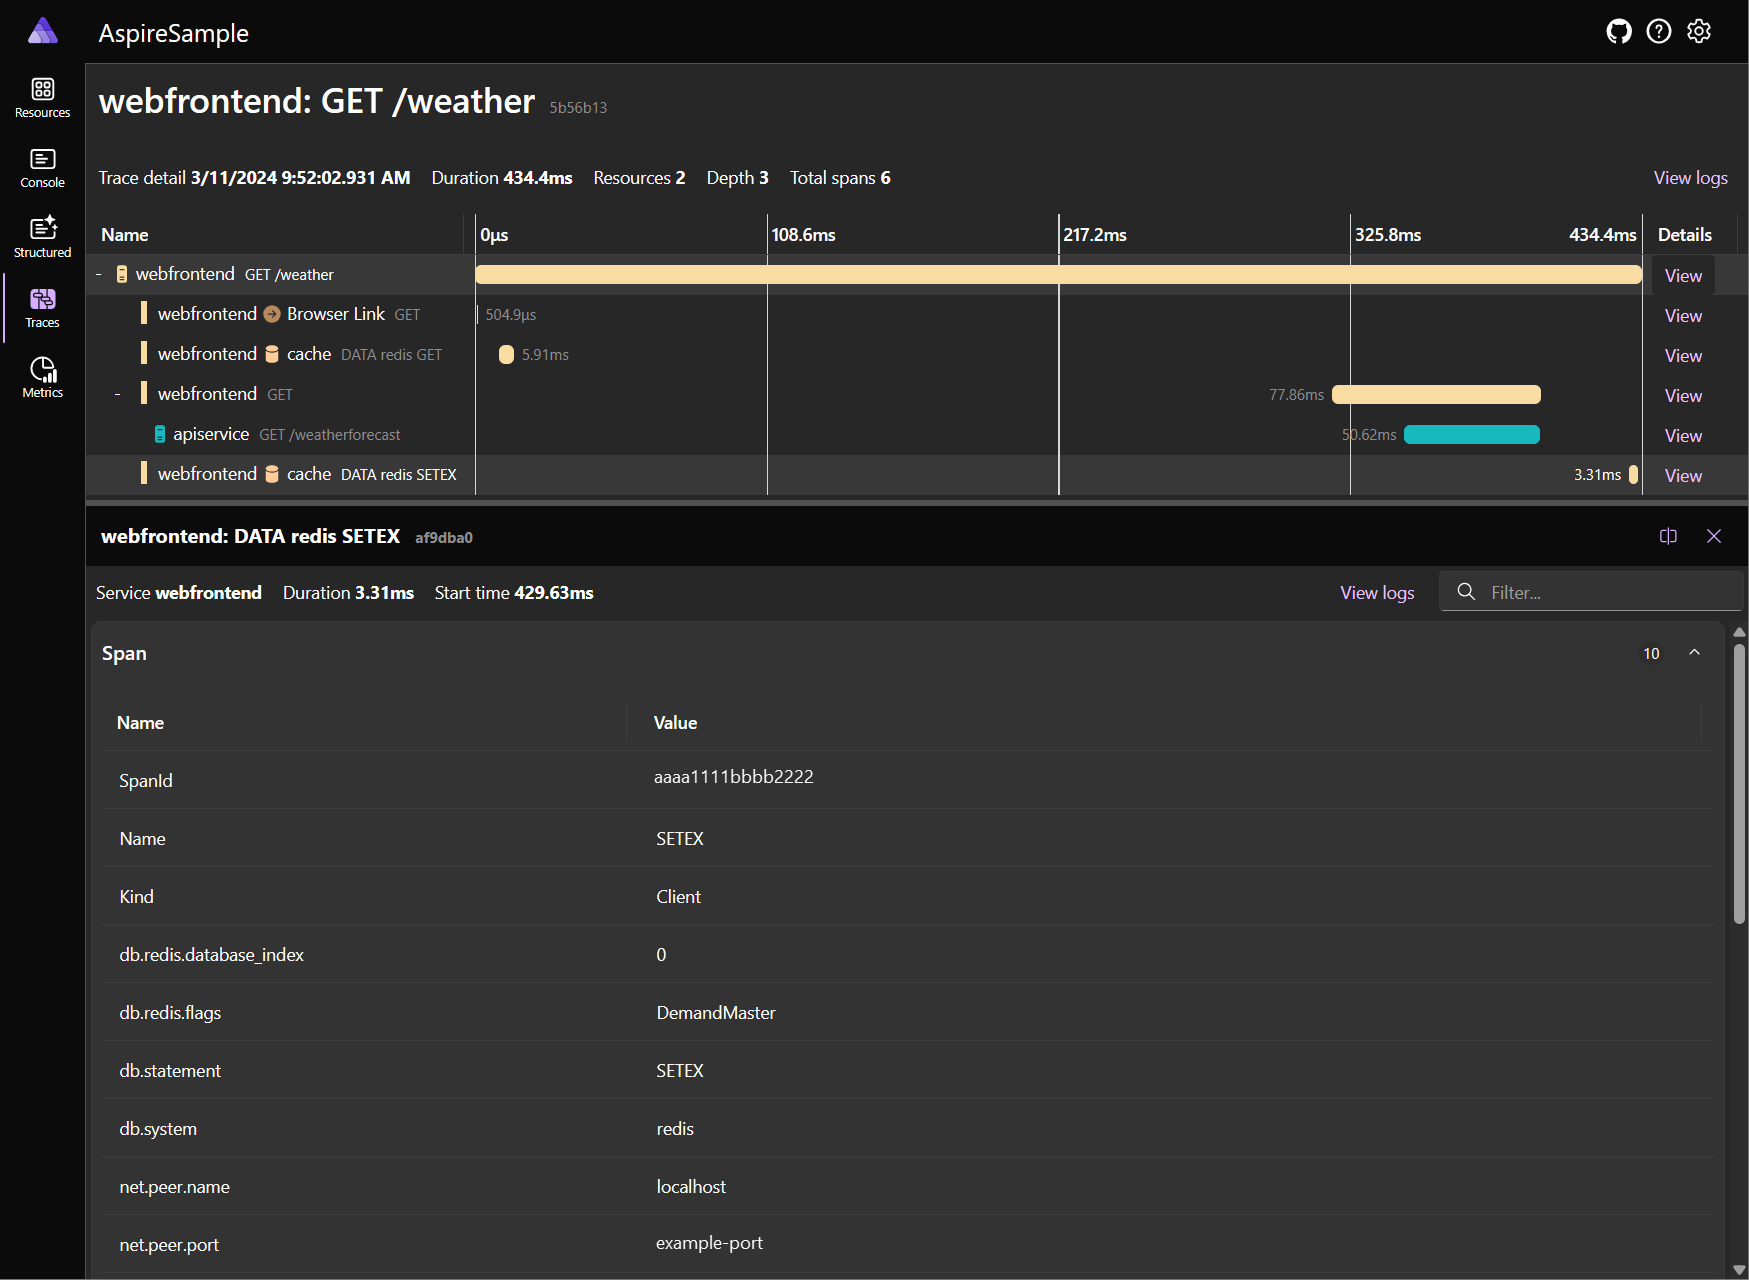
不过对应效果大致如 Aspire 一般
在VKProxy中如何使用?
默认情况,OpenTelemetry 已经启用,并且配置为 otlp 协议,大家只需配置otlp收集器,
相关配置如下:
| Environment variable | OtlpExporterOptions property |
|---|---|
| OTEL_EXPORTER_OTLP_ENDPOINT | Endpoint |
| OTEL_EXPORTER_OTLP_HEADERS | Headers |
| OTEL_EXPORTER_OTLP_TIMEOUT | TimeoutMilliseconds |
| OTEL_EXPORTER_OTLP_PROTOCOL | Protocol (grpc or http/protobuf) |
(更多详细配置参见OpenTelemetry.Exporter.OpenTelemetryProtocol)
这里我们用 Aspire 仪表盘举例
因为它有个独立模式,只需启动一个镜像就可以尝试一下,当然真实产线还是需要配置其他存储等等
docker run --rm -it -p 18888:18888 -p 4317:18889 -d --name aspire-dashboard mcr.microsoft.com/dotnet/aspire-dashboard:9.0 前面的 Docker 命令:
- 从 mcr.microsoft.com/dotnet/aspire-dashboard:9.0 映像启动容器。
- 公开两个端口的容器实例:
- 将仪表板的 OTLP 端口 18889 映射到主机的端口 4317。 端口 4317 从应用接收 OpenTelemetry 数据。 应用使用 OpenTelemetry 协议 (OTLP)发送数据。
- 将仪表板的端口 18888 映射到主机的端口 18888。 端口 18888 具有仪表板 UI。 导航到浏览器中 http://localhost:18888 以查看仪表板。
// 设置收集器环境变量 set OTEL_EXPORTER_OTLP_ENDPOINT=http://127.0.0.1:4317/ // 启动vkproxy (具体配置可参见之前的性能测试 https://www.cnblogs.com/fs7744/p/18978275 ) vkproxy proxy -c D:codegithubVKProxysamplesCoreDemotest.json 访问一下
curl --location 'https://localhost:5001/WeatherForecast' 可以在 Aspire 中看到相关链路信息

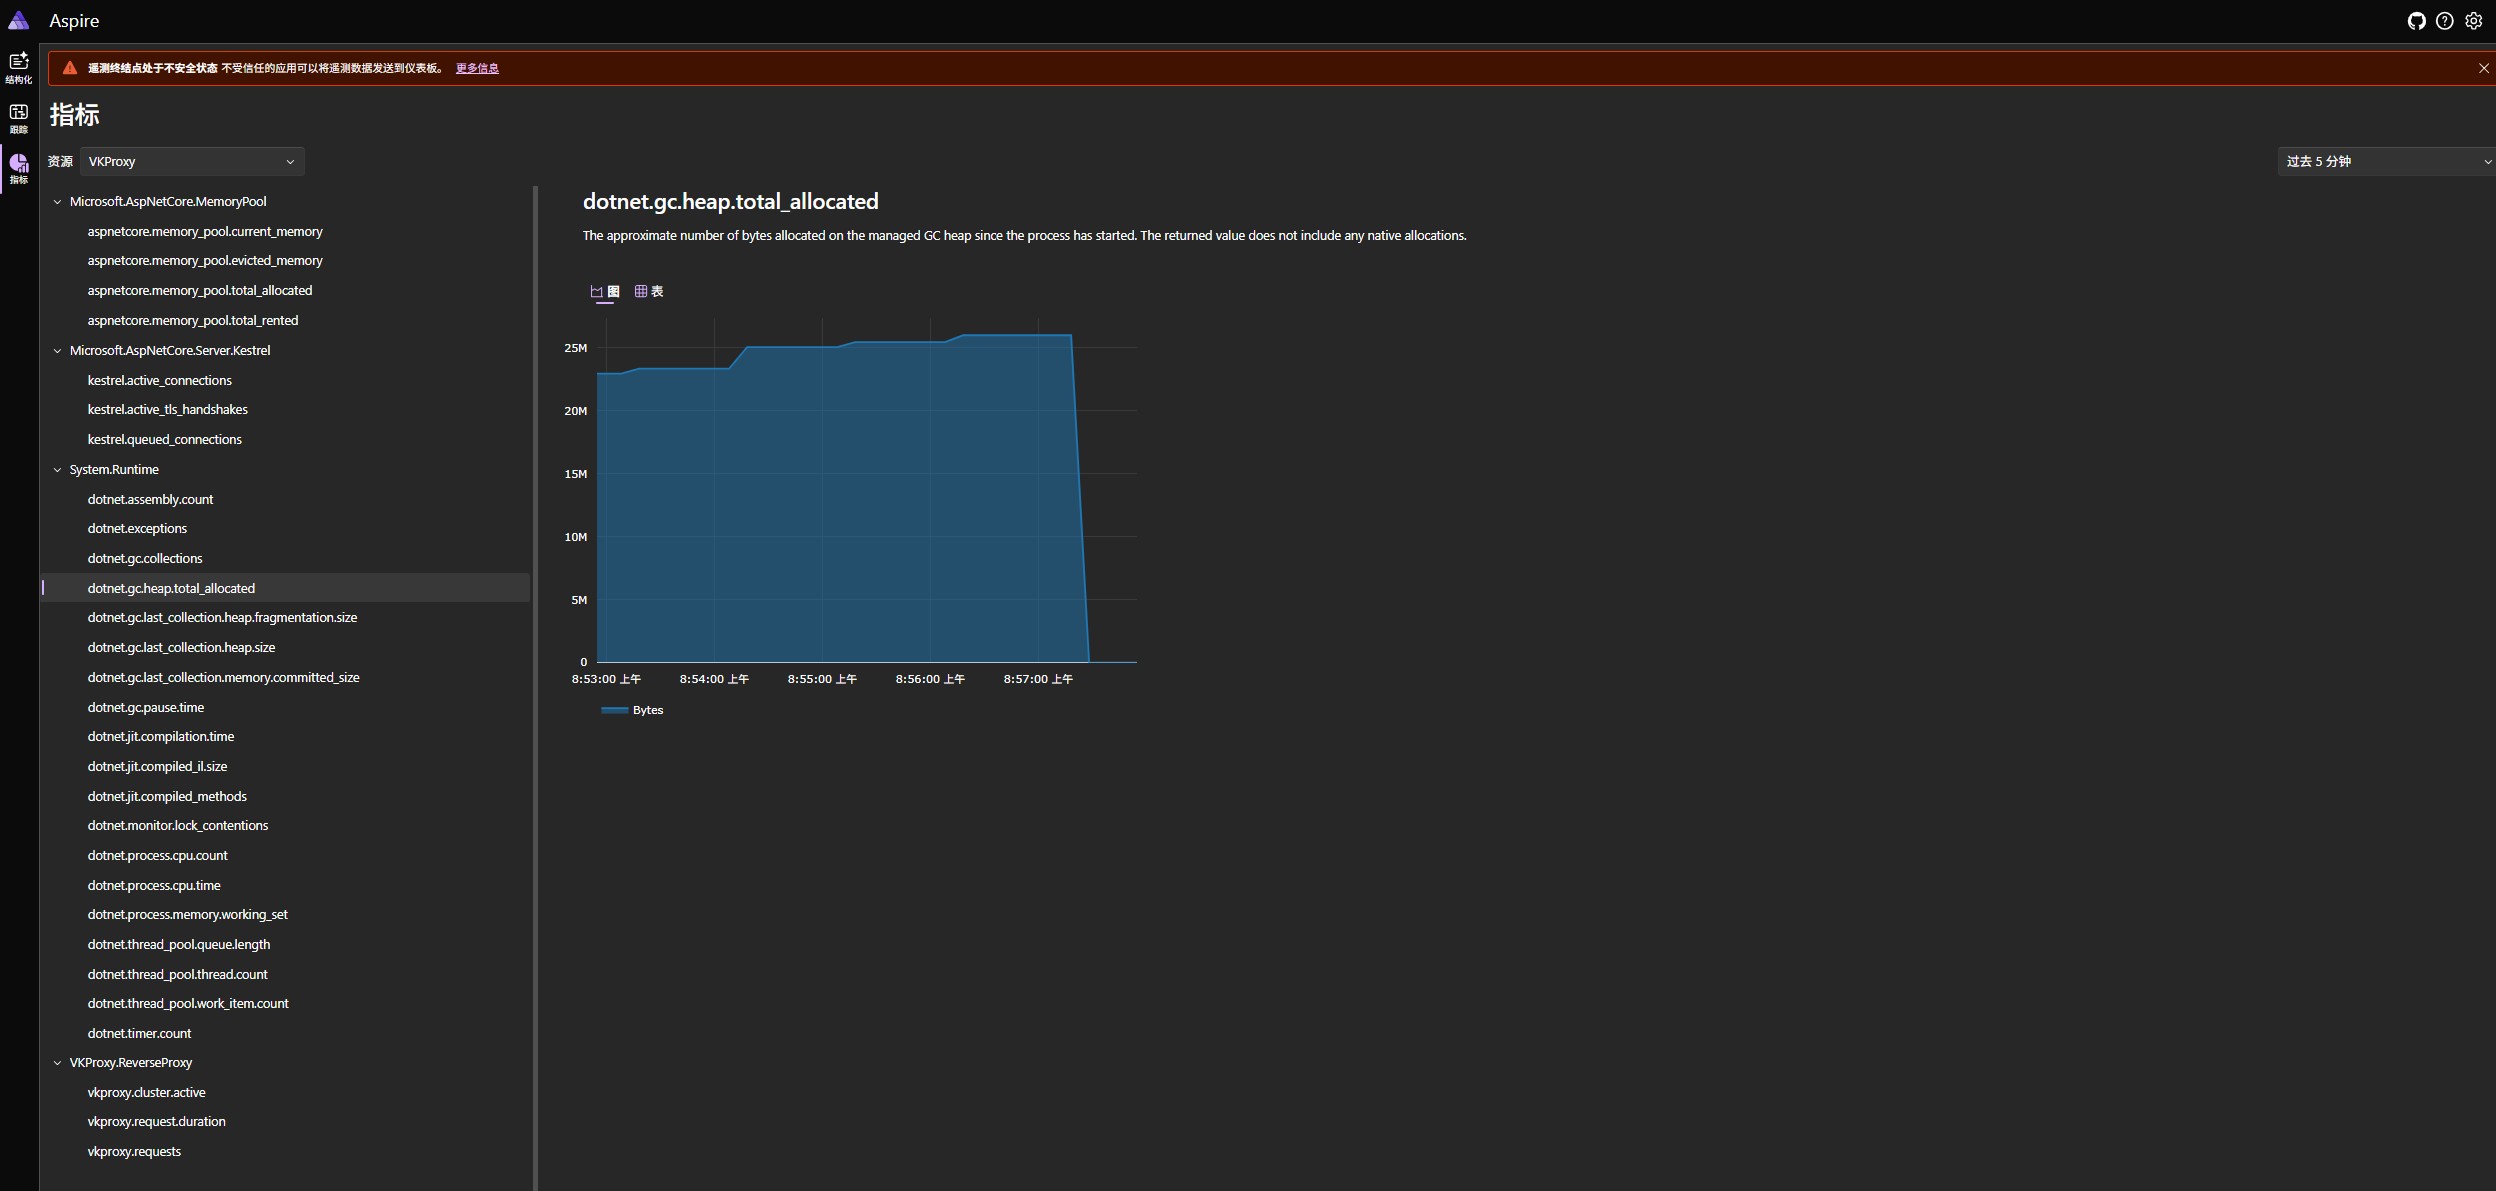
指标信息
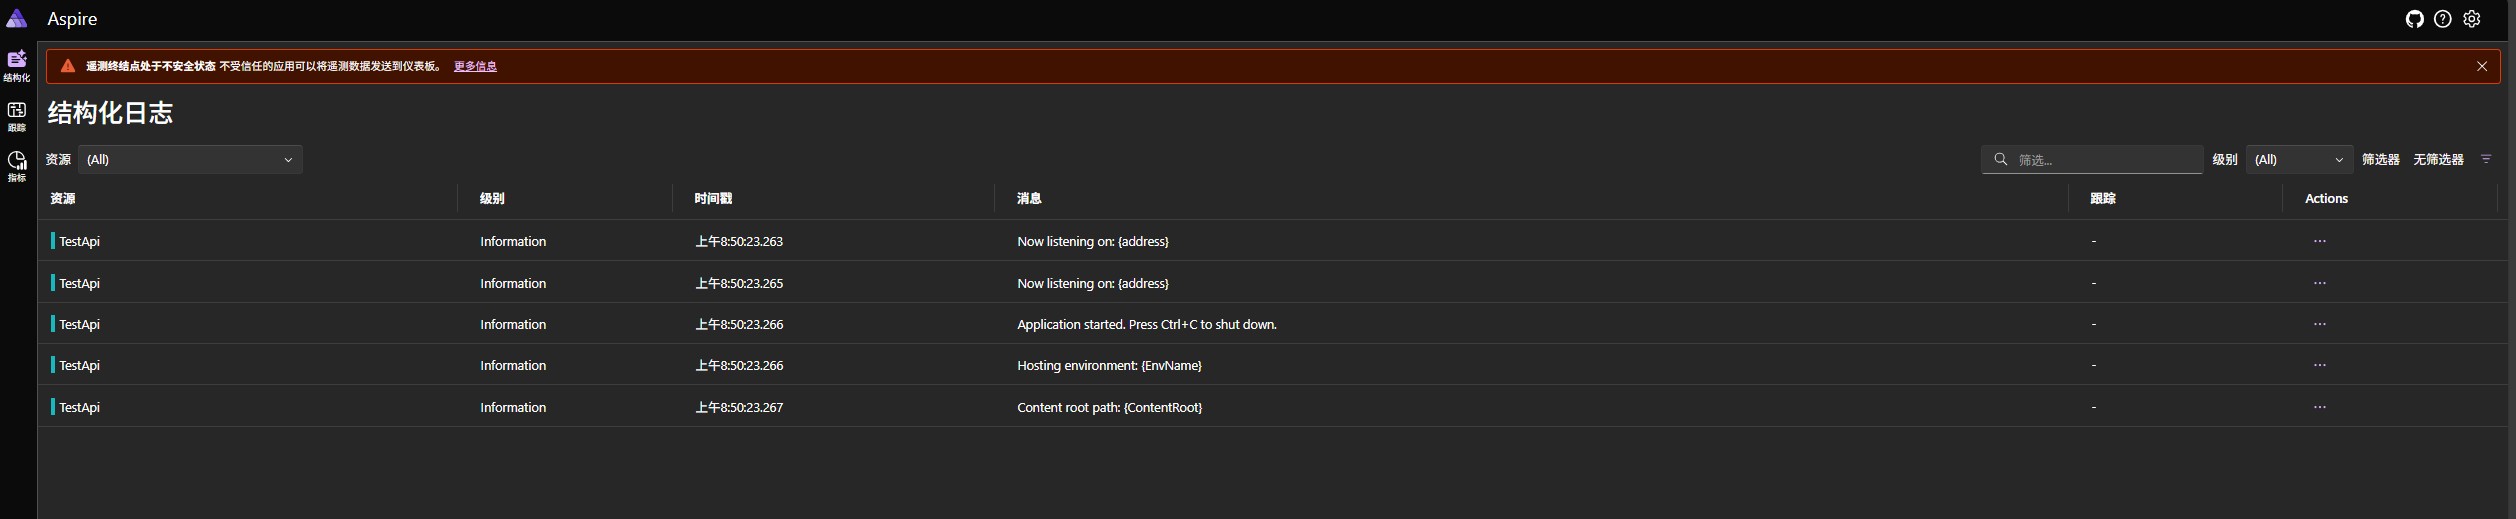
日志信息
当然你还可以通多如下命令调整过滤记录的信息
--telemetry (Environment:VKPROXY_TELEMETRY) Allow export telemetry data (metrics, logs, and traces) to help you analyze your software’s performance and behavior. --meter (Environment:VKPROXY_TELEMETRY_METER) Subscribe meters, default is System.Runtime,Microsoft.AspNetCore.Server.Kestrel,Microsoft.AspNetCore.Server.Kestrel.Udp,Microsoft.AspNetCore.MemoryPool,VKProxy.ReverseProxy --drop_instrument (Environment:VKPROXY_TELEMETRY_DROP_INSTRUMENT) Drop instruments --exporter (Environment:VKPROXY_TELEMETRY_EXPORTER) How to export telemetry data (metrics, logs, and traces), support prometheus,console,otlp , default is otlp, please set env like `OTEL_EXPORTER_OTLP_ENDPOINT=http://127.0.0.1:4317/` 测一测性能
.vegeta.exe attack -insecure -rate=10000/s -duration=60s -format=http -targets=http2proxy -output=http2proxyresults -http2 // http2proxy content: // GET https://127.0.0.1:5001/WeatherForecast 

汇总
Requests [total, rate, throughput] 599999, 10000.94, 9992.64 Duration [total, attack, wait] 59.994s, 59.994s, 0s Latencies [min, mean, 50, 90, 95, 99, max] 0s, 3.428ms, 2.015ms, 5.405ms, 6.882ms, 32.941ms, 301.44ms Bytes In [total, mean] 231889817, 386.48 Bytes Out [total, mean] 0, 0.00 Success [ratio] 99.92% Status Codes [code:count] 0:498 200:599501 Error Set: Get "https://127.0.0.1:5001/WeatherForecast": dial tcp 0.0.0.0:0->127.0.0.1:5001: connectex: No connection could be made because the target machine actively refused it. 之前没有遥测的性能测试汇总
Requests [total, rate, throughput] 599930, 9998.35, 9998.35 Duration [total, attack, wait] 1m0s, 1m0s, 0s Latencies [min, mean, 50, 90, 95, 99, max] 0s, 676.024µs, 0s, 2.56ms, 3.705ms, 5.367ms, 26.437ms Bytes In [total, mean] 232052167, 386.80 Bytes Out [total, mean] 0, 0.00 Success [ratio] 100.00% Status Codes [code:count] 200:599930 Error Set: 对比之前的测试而言,的确 otlp 遥测对性能有了不小的影响,但这点消耗单次请求看,消耗还是很低微的,总体利大于弊
VKProxy 是使用c#开发的基于 Kestrel 实现 L4/L7的代理(感兴趣的同学烦请点个github小赞赞呢)